

Factually inaccurate: According to the official data from the U.S. CDC, the daily number of vaccinations increased by 60% since Biden’s inauguration, not 85%.

AFFIRMATION COMPLETE: COVID-19 cases are “down by 50%” and “daily vaccinations have increased by 85%” since “Biden took office”
REVIEW
The COVID-19 pandemic that swept across the U.S. since early 2020 has caused almost 28 million identified cases and 500,000 deaths in the country. In the midst of this major health crisis, the U.S. have seen an important political shift with the inauguration of Joe Biden on 20 January 2021, succeeding Donald Trump as U.S. president.
Claims of significant improvement in the numbers of COVID-19 cases or vaccination rates circulated on social media, attributing the merit to the new administration. For example, this post by Occupy Democrats or this post by The Other 98% alleged that the number of new COVID-19 cases was down 50% and the number of daily vaccinations was up 85% since Biden took office. While data confirm that these trends are present, the numbers in the first example do not match the official figures. Furthermore, such claims are misleading as they don’t compare the trends in the number of new COVID-19 cases and vaccination rates before and after President Biden’s inauguration.
Daily number of new COVID-19 cases significantly decreased in January 2021 and the number of vaccination increased
The U.S. Centers for Disease Control and Prevention (CDC) reports the trends in the daily number of newly identified COVID-19 cases (Figure 1). From 20 January 2021—the day when Biden was sworn in—to 16 February 2021 when the Occupy Democrats meme was published, the average daily number of new cases fell steadily from 193,481 to 81,406 cases per day. This means that 4,000 fewer cases were identified on average each day over that 28-day period. Overall, this represents a 58% decrease, which is not far from the 50% figure cited in the meme.
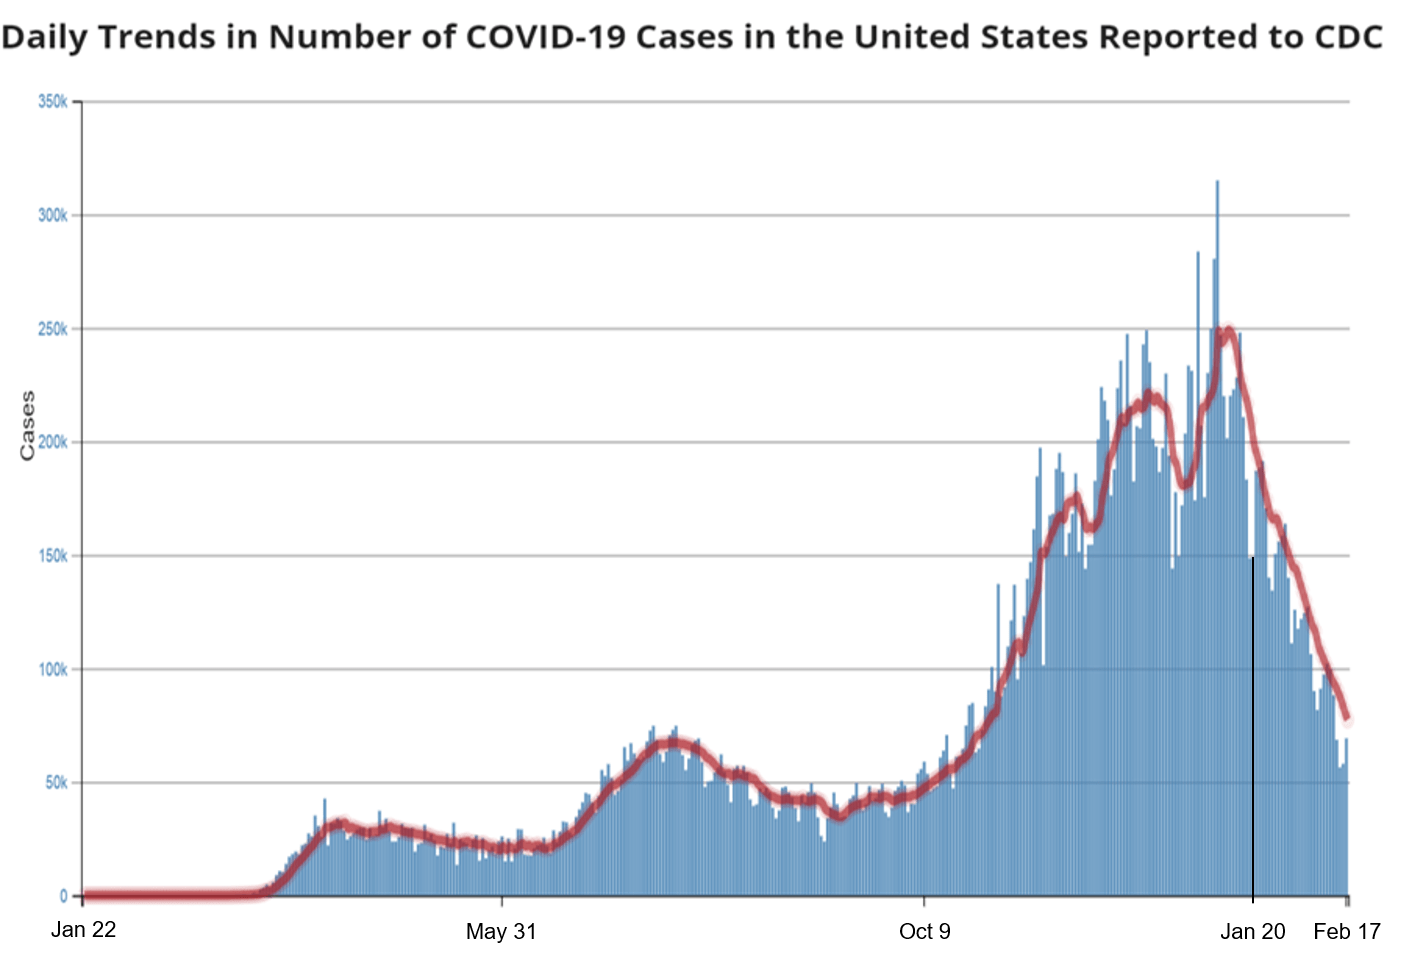
Figure 1. New identified COVID-19 cases reported by the CDC as of 19 February 2021. The blue bars represent the number of confirmed COVID-19 cases each day. The red curve represents the 7-day rolling average. Using a 7-day rolling average helps smoothing out the day-to-day variations. The vertical black line marks the inauguration of Joe Biden.
However, the number of new cases is of little relevance if it is not viewed in context with the number of tests performed. Indeed, significantly reducing the number of tests would automatically reduce the number of reported cases. It is therefore important to also look at the positivity rate together with the number of cases. The positivity rate is the percentage of COVID-19 diagnostic tests that returned a positive result.
The Johns Hopkins University gathered the data from 56 U.S. states and territories and presented a chart of these regions’ positivity rate over time (Figure 2). The positivity rate markedly decreased in 2021, from 9.7% on 20 January 2021 to 5.5% on 16 February 2021, or a reduction of 43%. Based on this analysis, there is a genuine decrease in cases and the decrease isn’t simply due to changes in the number of tests performed.
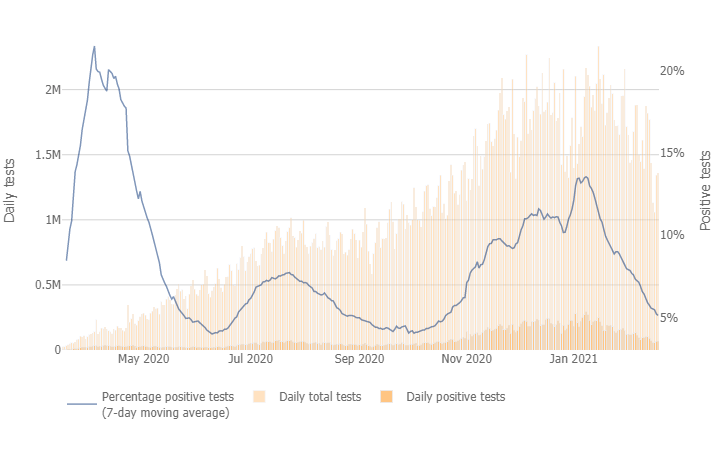
Figure 2. Trends in the COVID-19 positivity rate over time, reported by the Johns Hopkins University as of 19 February 2021. The number of COVID-19 diagnostic tests carried out each day are represented in light orange and those which returned positive results in dark orange. The proportion of positive tests, or positivity rate, is shown as a blue curve.
However, the daily number of vaccinations cited in the claim is less accurate. The CDC also presents the number of vaccinations performed per day (Figure 3). Owing to the important day-to-day variations—for example, there are less vaccinations occurring on Sundays—it is important to focus on the seven-day rolling average (red line) rather than on the daily counts.
The available average numbers stop on 13 February 2021. As the CDC explained, data from the most recent days are incomplete and still need to be consolidated. During the 25-day period from 20 January 2021 to 13 February 2021, the daily number of vaccinations rose from 965,982 to 1,543,466 doses, up by 60%. While the positive trend in vaccinations is clear, the figure of 60% is very different from the 85% cited in the claims.
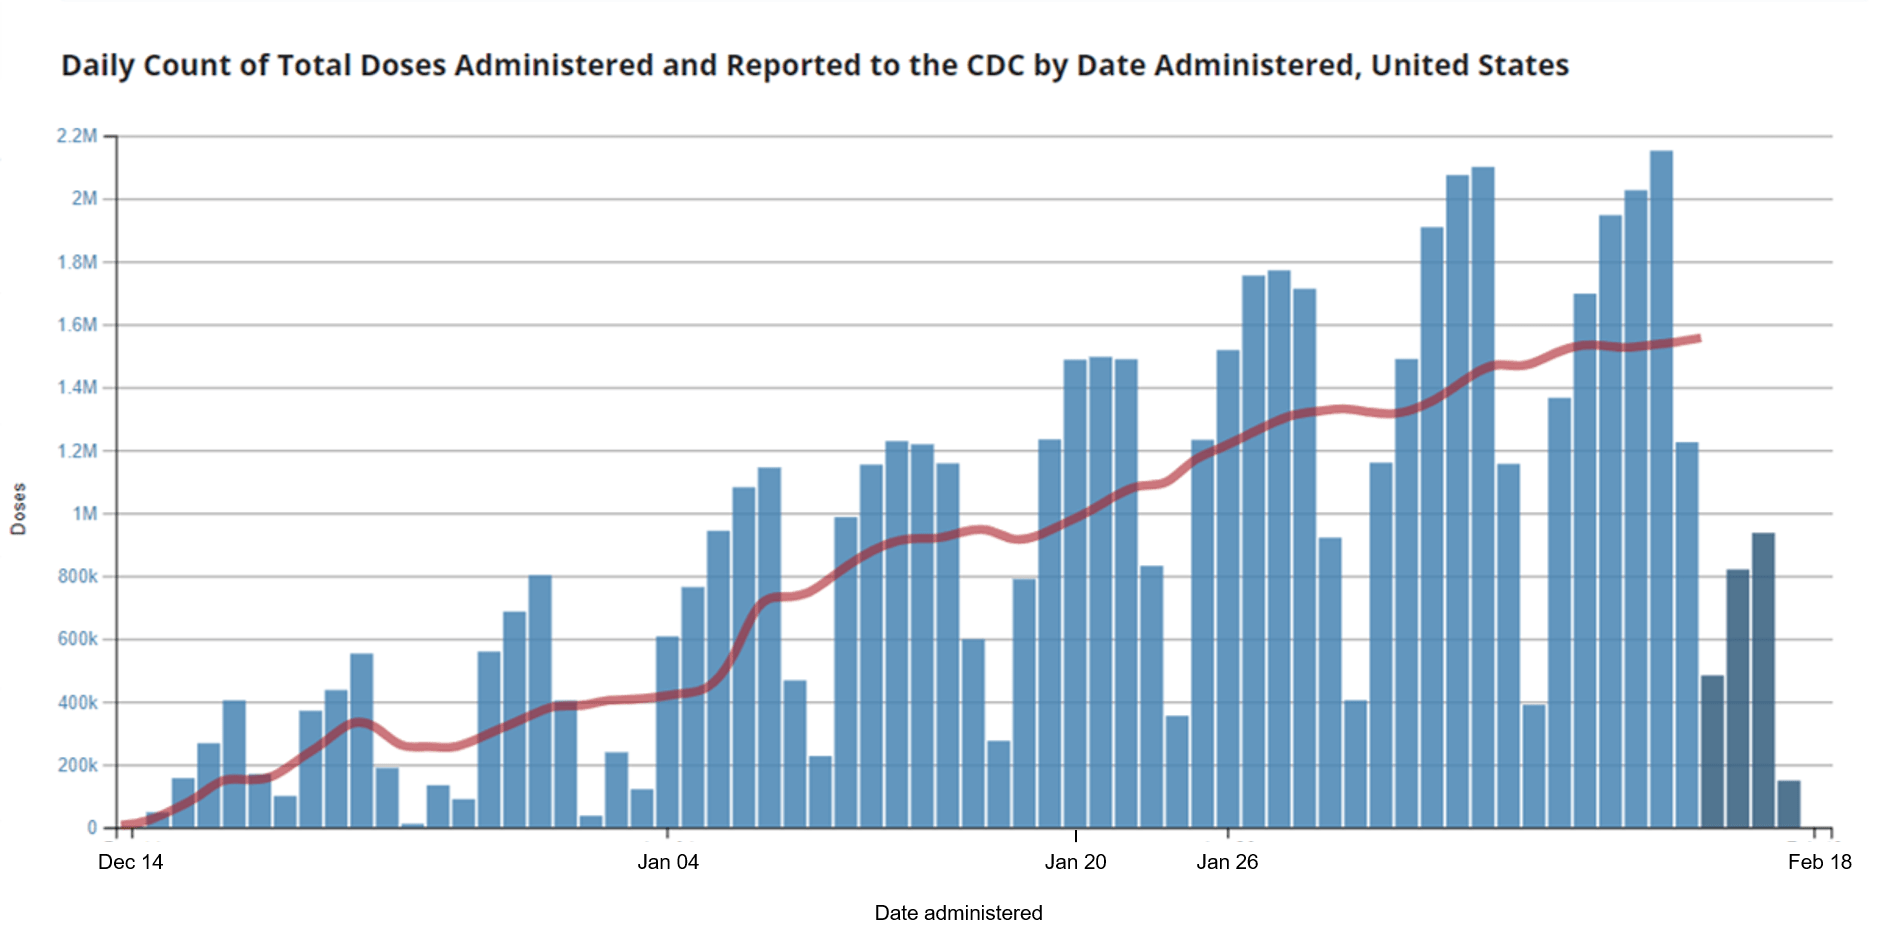
Figure 3. Daily number of vaccinations performed each day reported by the CDC, as of 19 February. The light blue bars represent the number of doses administered each day. The dark blue bars represent incomplete data: there is a lag in the reporting of administered doses which means that the most recent days are still underreported. The red line represents the 7-day rolling average, which allows to smooth out the day-to-day variations.
In general, the claims are accurate in stating that the number of new COVID-19 cases fell and the number of vaccinations steadily increased since the day when President Biden took office. However, analyzing the CDC data shows that the actual figures cited in these claims are inaccurate.
The rise in vaccination number and the drop in COVID-19 cases began before President Biden’s took office
The claims strongly suggested that the trends in new COVID-19 cases and vaccination is tied to Biden’s policies by using the day of his inauguration as the point of reference. This is apparent in this meme congratulating Biden and referring to his competence.
However, in order to properly assess whether President Biden taking office had an impact on those numbers, it would be necessary to compare the variation of COVID-19 cases before and after Biden took office. When we conducted this analysis, we found that the observed trends already began before 20 January 2021.
The CDC data showed that the number of daily new COVID-19 cases began dropping on 13 January 2021, one week before the inauguration (Figure 1). During that week, the daily number of new COVID-19 cases decreased from 243,799 to 193,481, which means that 6,289 less cases were identified each day. In fact, the rate at which cases fell was faster one week before the inauguration than during the period between 20 January and 16 February 2021.
The positivity data from the Johns Hopkins University exhibited a similar pattern, with the positivity already decreasing since 8 January 2021 (Figure 2).
This phenomenon is even clearer when it comes to vaccination. As shown by the CDC data, the 7-day rolling average of daily vaccinations has steadily increased since 14 December 2021. As mentioned earlier in this review, the daily number of vaccinations rose 60% during the 25-day period after President Biden took office. However, it actually rose 278% during a similar 25-day period right before the inauguration, from 27 December 2020 to 20 January 2021.
That the daily number of vaccination rose rapidly in the early stages of the vaccination campaign but slowed down when the vaccination operation reached full capacity is unsurprising. Therefore, the slower rate at which vaccinations were performed doesn’t mean that vaccination efforts have weakened since Biden’s inauguration. But it cannot be suggested that the increase of daily vaccination since 20 January is causally associated with Biden taking office.
In summary, COVID-19 cases are markedly decreasing in the U.S., while the daily rate of COVID-19 vaccination is steadily rising. However, the figures reported in the viral Facebook memes that we analyzed above are inconsistent with the data from the CDC. In addition, the data available so far don’t support the claim that the trends observed in the daily number of new cases and the number of vaccinations are causally associated with Biden taking office. The fall in the number of new cases and the rise in the number of vaccinations had already started before his inauguration, at a similar or even higher rate.