

Cherry-picking: The article only reports average rates of global sea level rise from two time periods and two studies, while ignoring all the other available data demonstrating that rates of sea level rise have accelerated since the 1990s.

AFFIRMATION COMPLETE: “A new analysis of global sea level rise rates concludes the rising trend was 1.56 mm/yr−¹ from 1900-2018. This is the same rate as for 1958-2014 (1.5 mm/yr−¹), indicating there has not been a long-term distinctive change in sea level rise rates in the last 120 years. Neither of these trends would appear to correlate well with the linearly accelerated rise in CO2 emissions since the 1940s.”
REVIEW
The claim that rates of sea level rise haven’t significantly changed in the past 120 years appeared in blog posts published by NoTricksZone and ‘Watts Up With That?’ in January 2021. Contrary to the claim, scientific studies show that rates of global sea level rise have changed over time and accelerated, notably since the 1990s, primarily due to glacial ice melting and the expansion of seawater as it warms[1-4].
To evaluate how the rate of sea level rise has changed over time, scientists evaluate long-term trends in mean sea level, primarily based on data from tide gauges and satellites. They can then use these observations to calculate whether this rate has increased, decreased, or remained the same over time. These studies consistently show a distinct pattern of accelerated rates of global mean sea level (GMSL) rise since the 1990s (see figure 1)[2,3].
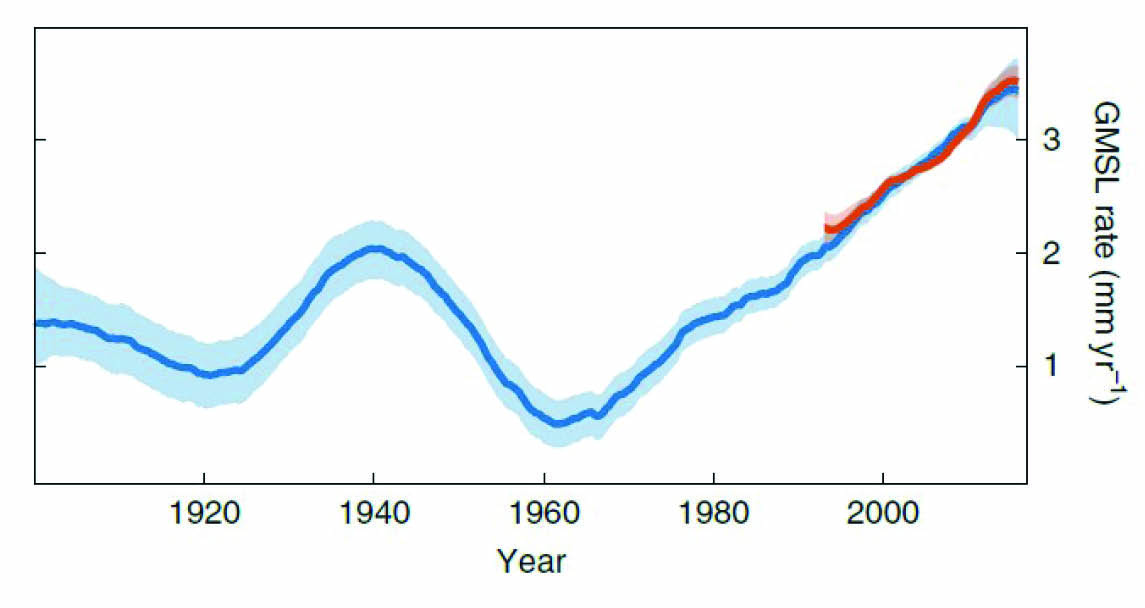
Figure 1—Global mean sea level (GMSL) trend in mm per year from 1900 to 2015, based on data from tide gauges and satellites. From Dangendorf et al. (2019)[3].
Instead of evaluating all available scientific studies exploring rates of global sea level rise, the bloggers only present data from two time periods and two papers, ignoring everything else and drawing a misleading conclusion. Furthermore, the bloggers do not calculate the rate of acceleration in GMSL. Doing so would indicate that GMSL has accelerated at a rate of about 0.012 mm yr-2 from 1900 to 2018, as Frederikse, the author of the study on which the bloggers rely, describes below. Therefore, the bloggers’ claims are inaccurate and based on cherry-picked data.
While the overall rate of GMSL has accelerated since 1900, the rate of change also varies over time. Specifically, there were higher rates of sea level rise during the 1940s and since the 1990s and lower rates of sea level rise in the 1920s and 1970s (see figure 1)[2,3]. One study demonstrates that the rate of GMSL has accelerated over the past two decades, estimating that from 1993 to 2018 GMSL rose 3.35 mm per year, more than double the average rate from 1900-2018[2].
These estimates of accelerated rates of sea level rise are supported by additional scientific studies. For instance, Dangendorf et al. (2019) describes, “the pace of GMSL has been accelerating since 1993, which is consistent with independent estimates of increasing mass contributions from Greenland and Antarctica over the last two decades.”[3]
An analysis from 14 studies that estimates rates of GMSL using satellite and tide gauge data also show clear patterns of accelerated rates since 1993 (see figure 2)[4].
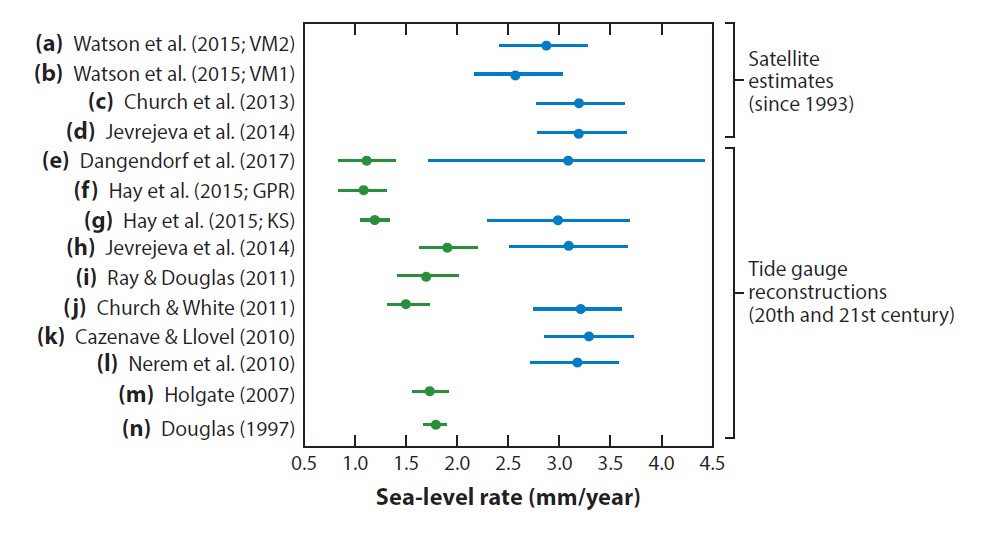
Figure 2 – Rates of sea level rise over the 20th century (green) and since 1992 (blue). The time windows for each paper cited are as follows: (a) 1993–2014; (b) 1993–2014; (c) 1993–2010; (d) 1993–2009; (e) 1901–1990 (green), 1993–2012 (blue); ( f ) 1901–1990; (g) 1901–1990 (green), 1993–2010 (blue); (h) 1900–1999 (green), 1993–2009 (blue); (i) 1900–2009; ( j) 1901–1990 (green), 1993–2009 (blue); (k) 1992–2010; (l) 1993–2010; (m) 1904–2003; (n) 1880–1990. From Horton et al. (2018)[4].
While rates of GMSL have changed over time, there has been an unambiguous rise in sea level over time, as measured by tide gauges and satellites (see figure 3).
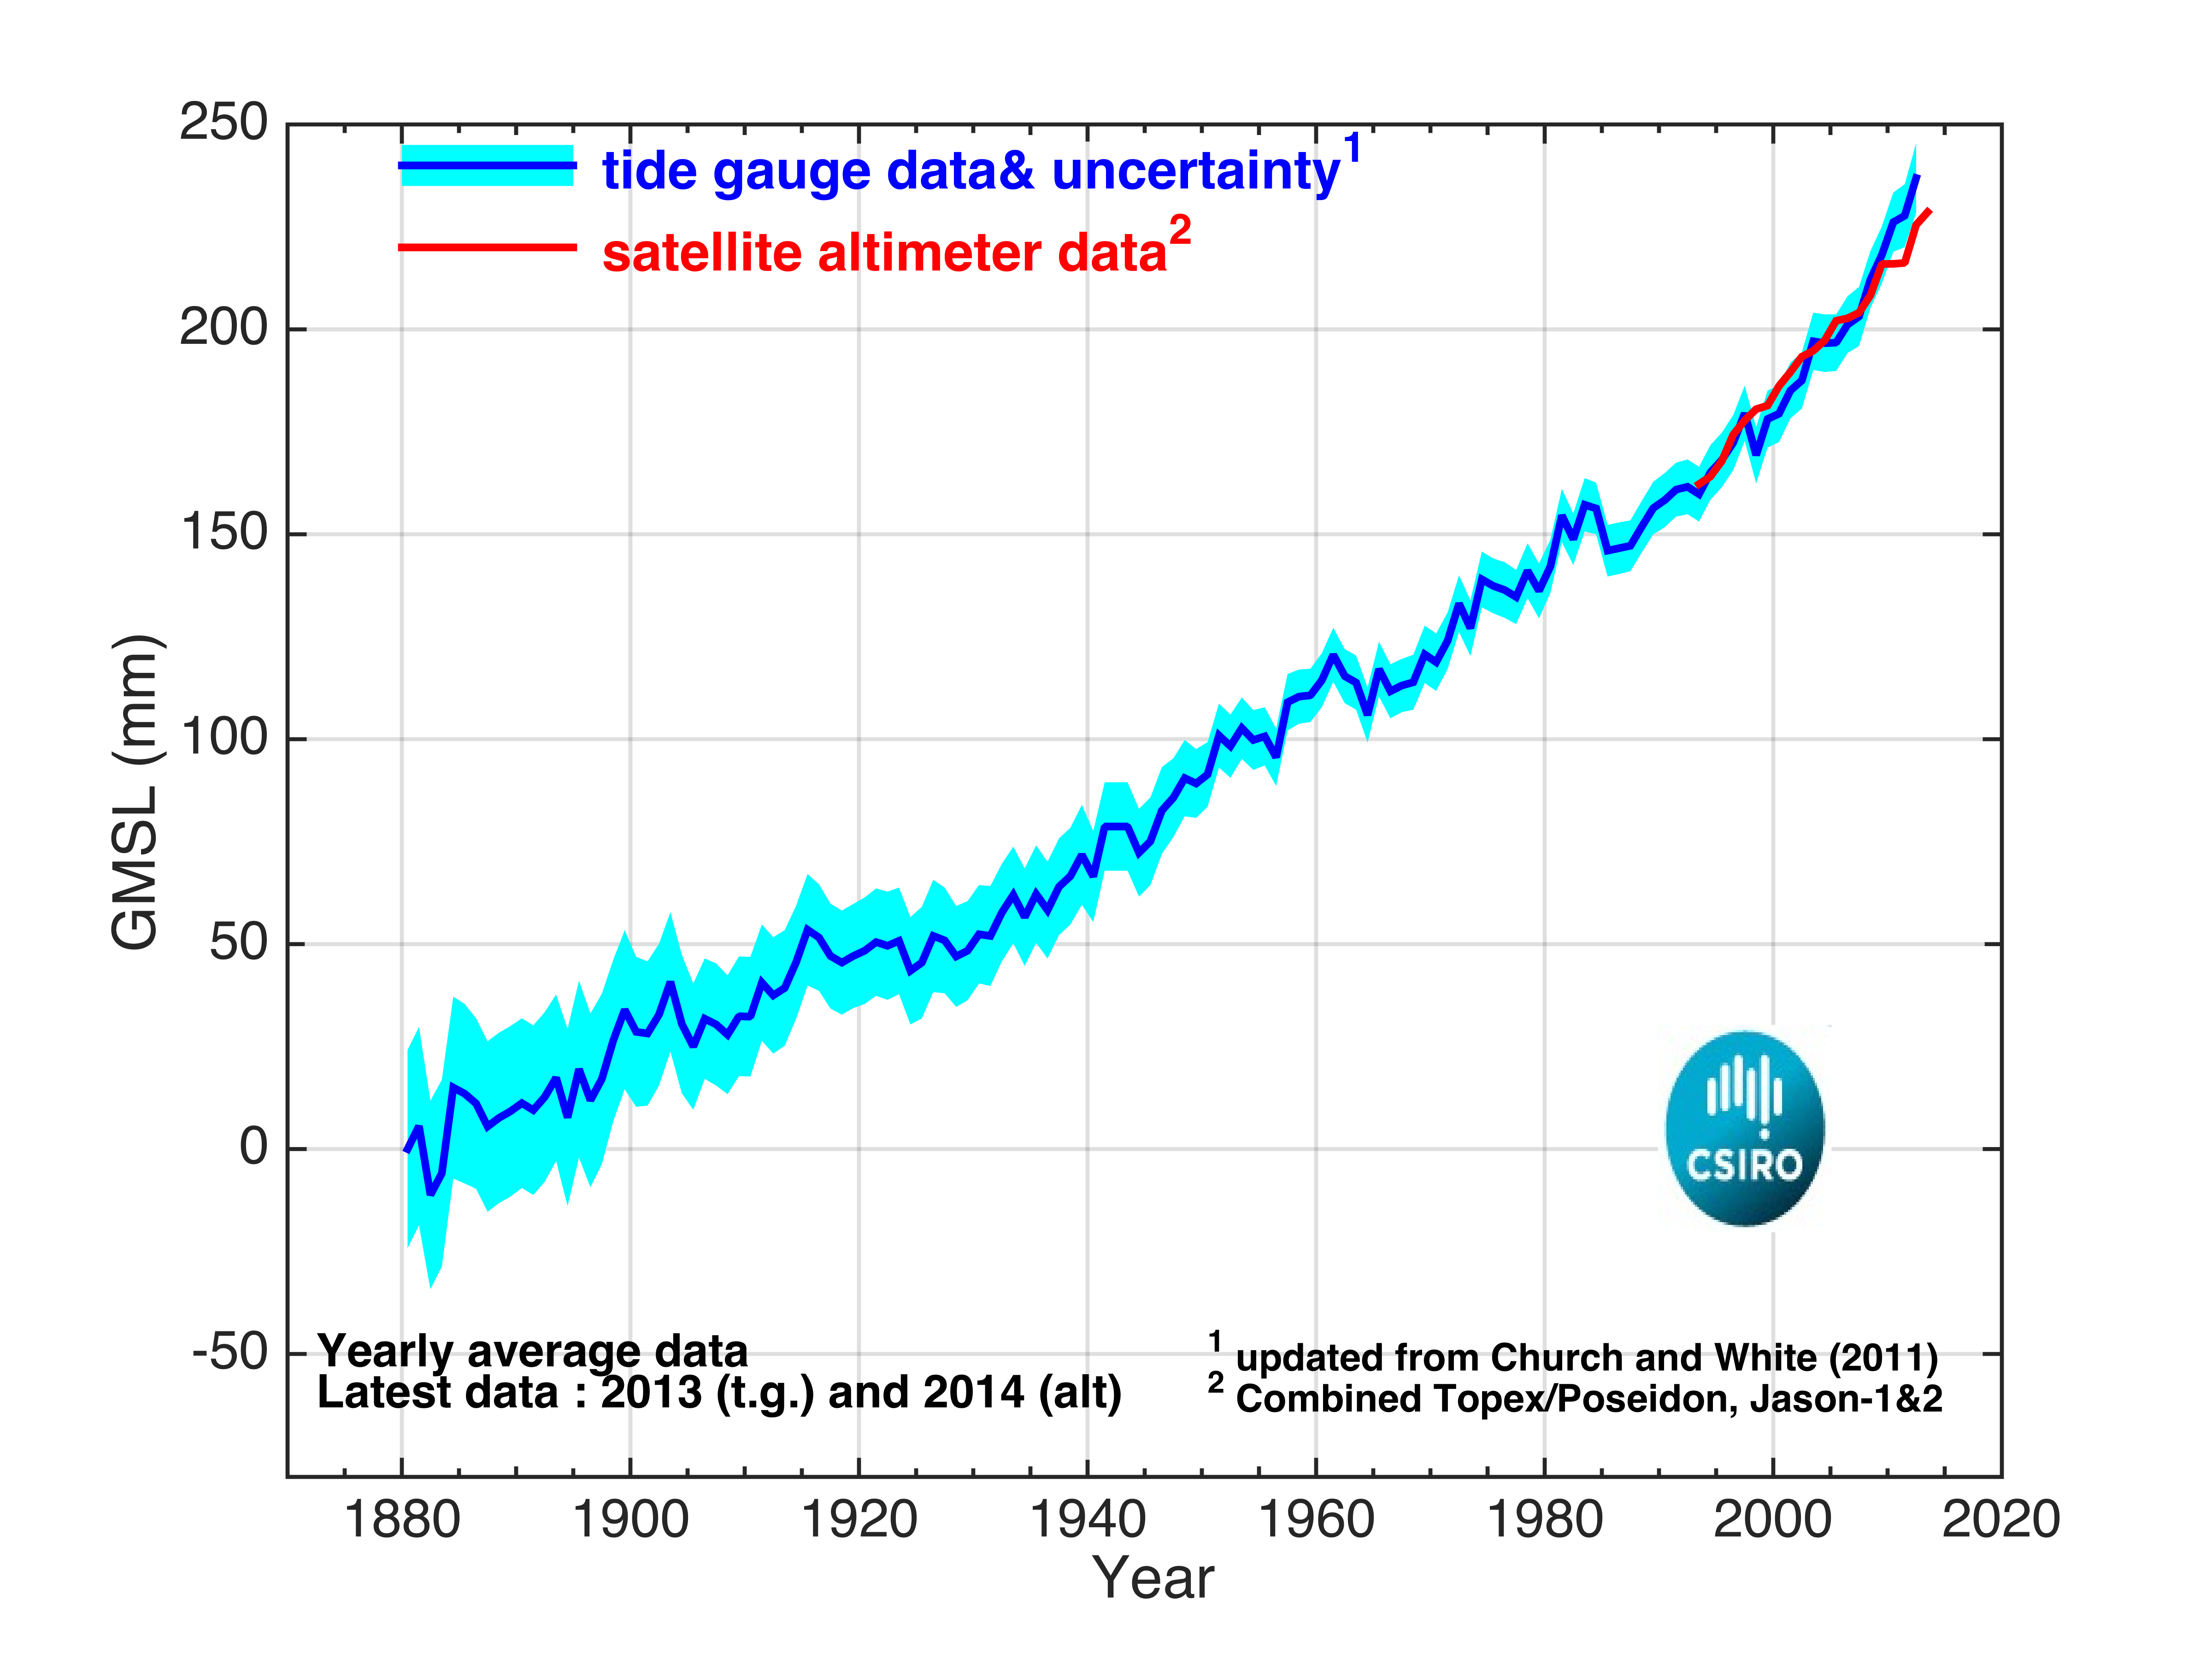
Figure 3 – Changes in global mean sea level from 1880 – 2014.
Sea level variations are caused by a variety of natural and human-caused factors. While land mass movements and ocean circulation patterns influence sea levels, human-induced climate change is accelerating the rate of sea level rise[5]. Specifically, greenhouse gas emissions have increased global temperatures, causing ice sheets to melt and oceans to thermally expand. For example, one study found that the rate of sea level rise since 2000 resulting from the expansion of seawater as it warms “is significantly greater than at any moment in the twentieth century.”[2]
SCIENTISTS’ FEEDBACK
Thomas Frederikse, Postdoctoral researcher, Jet Propulsion Laboratory/California Institute of Technology:
This text cherry-picks two trend estimates of global sea levels (one number from 1900-2018 and one number from 1958-2014) to ‘show’ there’s no acceleration in global sea level since 1900. That is false. Global sea levels have accelerated since 1900, something that the authors could have calculated themselves by fitting a second-order polynomial through the time series of global sea level, which are publicly available. That simple calculation gives a significant and positive acceleration in global sea level of 0.012 +/- 0.004 mm yr-2 over 1900-2018. Instead, the article just takes two numbers and draws conclusions without looking into the actual numbers.
The article also discusses the lack of direct correlation between CO2 emissions and global sea levels, due to the above-average rates of sea level and glacier mass loss in the 1930s. This is an oversimplification of the physics behind global sea levels, since many more processes than just CO2 affect global sea levels. As a result, such a clear correlation is not expected. For example, the above-average rate around ~1930 can be traced down to regional heatwaves in the Arctic region, causing a lot of ice melt[3], while a large part of the slowdown in the rate of global sea-level rise can be tracked down to retention of water behind newly-constructed dams[6].
In conclusion, this article cherry-picks numbers to claim there’s no acceleration in global sea level.
Benjamin Horton, Professor, Earth Observatory of Singapore:
A review paper I wrote shows that for every paper that calculated present day sea level rise there is a clear increase in rate[4].
REFERENCES:
- 1 – Frederikse et al. (2018) A Consistent Sea-Level Reconstruction and Its Budget on Basin and Global Scales over 1958–2014. Journal of Climate.
- 2 – Frederikse et al. (2020) The causes of sea-level rise since 1900. Nature.
- 3 – Dangendorf et al. (2019) Persistent acceleration in global sea-level rise since the 1960s. Nature Climate Change.
- 4 – Horton et al. (2018) Mapping Sea-Level Change in Time, Space, and Probability. Annual Review of Environment and Resources.
- 5 – Slangen et al. (2016) Anthropogenic forcing dominates global mean sea-level rise since 1970. Nature Climate Change
- 6 – Church and White (2011). Sea-Level Rise from the Late 19th to the Early 21st Century. Surveys in Geophysics.