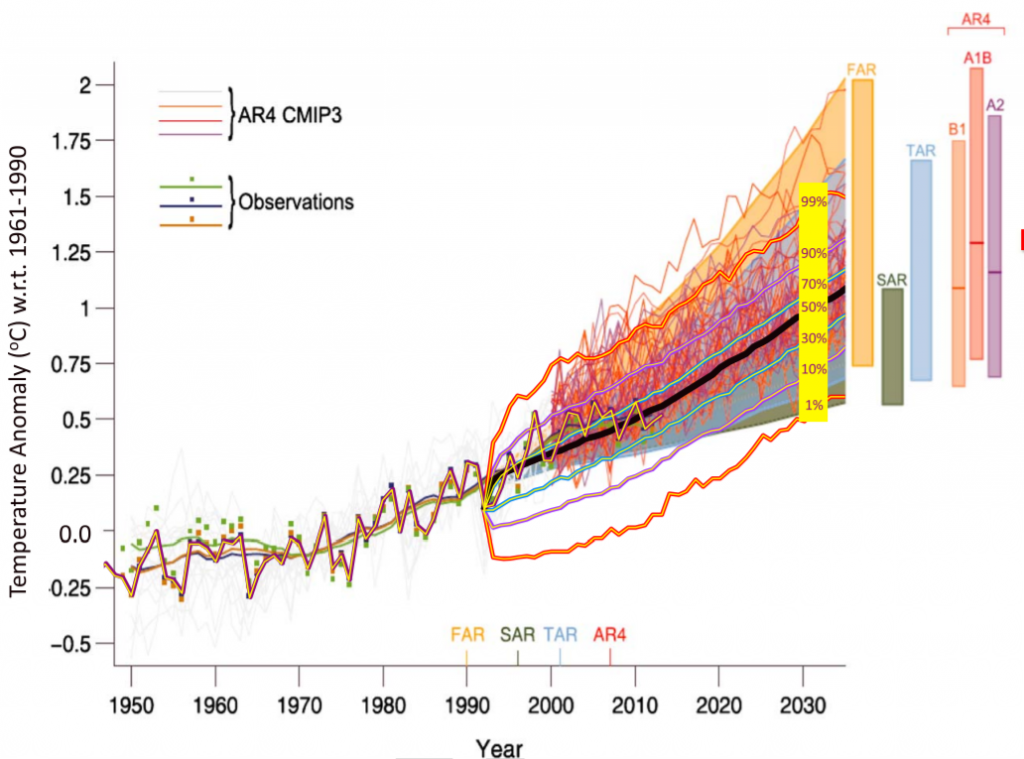

RECLAMACION: the warming is not nearly as great as the climate change computer models have predicted. […]U.N. Intergovernmental Panel on Climate Change simulations forecast surface temperatures to increase on average 0.2 degrees Celsius per decade in the early 21st century. The warming over the first 15 years was closer to 0.05 degrees Celsius.
Christopher Merchant, Professor, University of Reading and UK National Centre for Earth Observation:
Although climate modellers tend to quote the trend to warmer temperatures in units of “degrees per decade”, it is a misunderstanding to interpret that to mean that they expect every decade to have that trend. This is why in the quoted statement, the forecast is for increases to be “on average” 0.2 °C. Just as weather fluctuates from day to day, there are fluctuations between years and decades, too.
Piers Forster, Professor, University of Leeds:
The high emissions scenario (RCP8.5) model simulations did show around 0.2 °C warming per decade. But the IPCC report (Chapter 11, WG1, AR5, Fig 11.25) never relied on just these runs to make its prediction. It relied on multiple lines of evidence. Its temperature prediction was in fact around 0.05 to 0.15 C per decade.
The statement “the warming over the first 15 years is 0.05 °C per decade” is not correct. (This was probably meant to be degrees per decade from an old version of the HadCRUT dataset with limited coverage on the Arctic). The latest analysis and synthesis of the different records published in Science in January* constrains sea-surface temperatures trends over the last 19 years to between 0.07 and 0.12 °C per decade. Global temperatures have been rising slightly faster than this due to land surface warming more.
- Hausfather et al (2017) Assessing recent warming using instrumentally homogeneous sea surface temperature records, Science Advances
Zeke Hausfather, Research Scientist, Berkeley Earth:
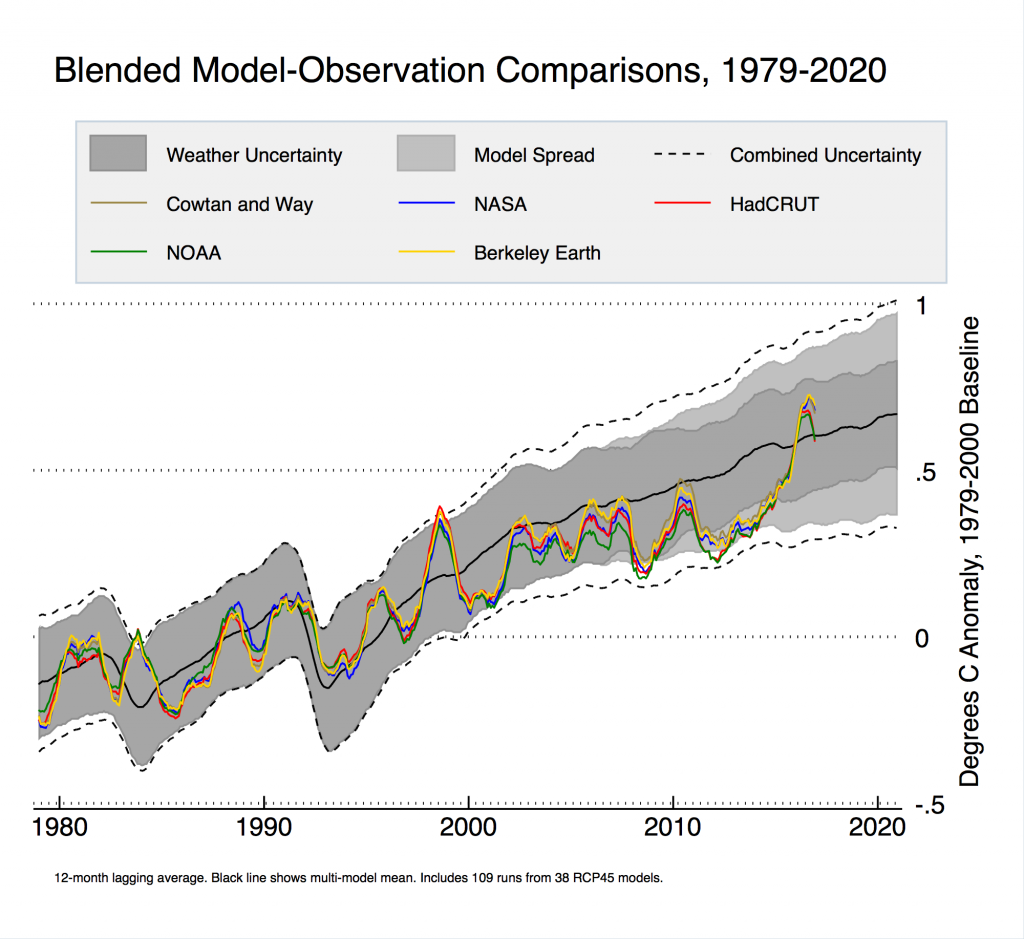
Since the start of the 21st century, climate models predict 0.2 °C per decade surface warming. Observed surface warming over that same period has been 0.2 °C (NASA), 0.19 °C (NOAA) 0.18 °C (Berkeley/ Cowtan and Way), and 0.16 °C (Hadley). All of these are statistically indifferentiable from model projections over this period. In general, recent temperatures have been pretty close to the multi-model mean:
Model comparisons with satellite data are more difficult as satellites don’t measure the Earth’s surface temperature. Some satellite records (RSSv4, UAHv5.6) are in reasonable agreement with model projections for tropospheric temperatures between 2000 and present, while others (UAHv6 beta, RSSv3) are notably cooler.
Shaun Lovejoy, Professor, McGill University:
The figure below from Lovejoy (2015)* gives some details, but the basic claim of 0.2 °C too high is essentially correct. However, as the figure shows, the temperature was accurately forecast (actually hindcast) to within 0.05 °C by using a stochastic (not General Circulation Model) modelling approach.
The stochastic approach worked well because the so-called pause (since 1998) was actually simply a return to the long-term (anthropogenically forced) trend that followed the massive pre-pause warming from 1992 to1998. The key point is that the fact that General Circulation Model’s tended to over-forecast the warming is a model and/or data problem (there are many different explanations in the literature), but this in no way alters the fact that the temperatures are almost exactly varying about the long term anthropogenic trend as expected.

- Lovejoy (2015) Using scaling for macroweather forecasting including the pause, Geophysical Research Letters


