Four scientists analyzed the article and estimate its overall scientific credibility to be 'high'. more about the credibility rating
A majority of reviewers tagged the article as: Accurate, Insightful.

SCIENTISTS‘ FEEDBACK
SUMMARY
This article in The Washington Post describes an important study from a project called the Ice sheet Mass Balance Intercomparison Exercise (or IMBIE), which synthesized many existing records of Antarctic ice based on different types of measurements. The resulting estimate shows that Antarctica alone lost enough ice between 1992 and 2017 to raise global sea level by around 7.6 millimeters—almost 10% of the total sea level change over that time period.
Scientists who reviewed the article found that it accurately summarized this result, while explaining some of the processes behind this mass loss and the sea level rise it produces. However, they note that future trends depend partly on complex natural variability, which the article could have made clear.
See all the scientists’ annotations in context
REVIEWERS’ OVERALL FEEDBACK
These comments are the overall opinion of scientists on the article, they are substantiated by their knowledge in the field and by the content of the analysis in the annotations on the article.
Thomas Frederikse, Postdoctoral researcher, Jet Propulsion Laboratory/California Institute of Technology:
The article accurately summarises the main conclusions of the discussed study, and multiple experts give a clear overview of the current knowledge of the fate of the Antarctic ice sheet and associated sea level rise under global warming.
Peter Neff, Postdoctoral research associate, University of Washington:
Chris Mooney’s article on recent Antarctic ice mass loss results faithfully reports on the new data, providing a wealth of useful information to the reader. However, a lack of exploration of the causes of this Antarctic ice mass loss leaves the article vulnerable to being wrongly filed under „one more depressing impact of human-caused climate change“ when the true story is more complex. From the article’s title, Mooney would have done well to address what processes, in addition to continued atmospheric warming, may cause continued Antarctic ice mass loss.
Anna Hughes, Lecturer, University of Manchester:
The article presents the results of the study accurately, and uses multiple comments from scientists both involved and not-involved in the study to highlight the key findings. Some of the explanations are simplified, and there is a slight attempt at the end to downplay the results by suggesting scientists can’t predict the future. It is correct that the study presented is not making predictions, rather documenting past changes, but the positive trend is what we would expect based on the longer record of change we have for glaciers and ice caps.
An informative article citing relevant experts, and a good explainer of the findings of the IMBIE study.
Notes:
[1] See the rating guidelines used for article evaluations.
[2] Each evaluation is independent. Scientists‘ comments are all published at the same time.
KEY TAKE-AWAYS
The statements quoted below are from the article; comments and replies are from the reviewers.
“Antarctica’s ice sheet is melting at a rapidly increasing rate, now pouring more than 200 billion tons of ice into the ocean annually and raising sea levels a half millimeter every year, a team of 80 scientists reported Wednesday.”
Peter Neff, Postdoctoral research associate, University of Washington:
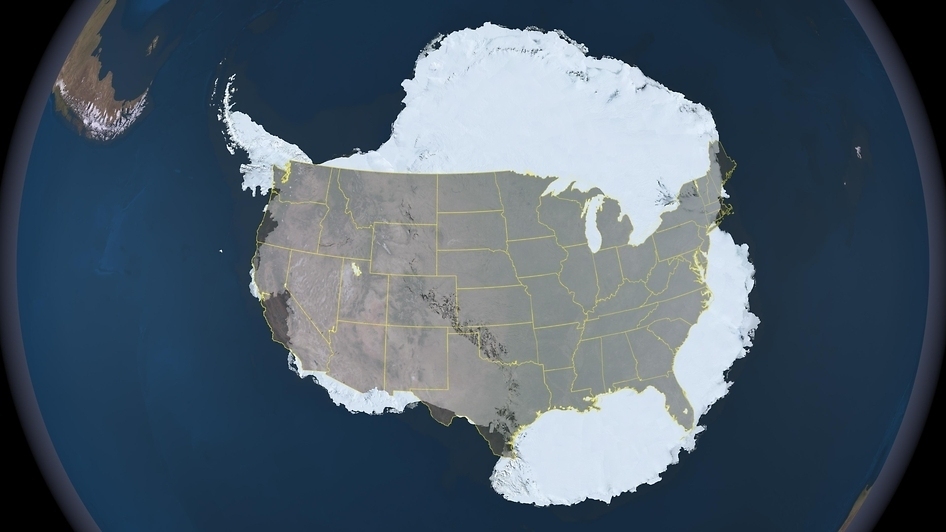
If these numbers seem abstract, consider this: Much of the ice mass loss is focused along the Amundsen Sea coast of West Antarctica. This is essentially the Pacific Coast of West Antarctica, which is roughly the same length as the Pacific Coast of the United States (~1200 miles, 1900 kilometers). The two Pacific Coasts—of the USA and the Antarctic—are overlain in this NASA image:

Basically, this entire Pacific coast of West Antarctica is where Antarctic ice mass loss comes from, as can be seen in this animation of GRACE satellite gravity measurements from 2002-2016 which were part of the IMBIE study.
In this illustration you can also see a „hot-spot“ of mass loss on the left side of the Antarctic map, where Totten Glacier drains a portion of the East Antarctic ice sheet that is also increasingly losing mass.
“Antarctica, the planet’s largest ice sheet, lost 219 billion tons of ice annually from 2012 through 2017 — approximately triple the 73 billion ton melt rate of a decade ago, the scientists concluded. From 1992 through 1997, Antarctica lost 49 billion tons of ice annually.”
Thomas Frederikse, Postdoctoral researcher, Jet Propulsion Laboratory/California Institute of Technology:
This is a correct summary of the results from the study.
This translates to about 0.6 mm/yr in 2012-2017, while the 1992-1997 rates were 0.14 mm/yr. This may not sound like much, but the current total rate of sea-level rise is around 3.2 mm/yr, so Antarctica is responsible for an increasingly large portion of the observed sea-level rise.
“The study is the product of a large group of Antarctic experts who collectively reviewed 24 recent measurements of Antarctic ice loss, reconciling their differences to produce the most definitive figures yet on changes in Antarctica.”
This sounds like there are only 24 data points, but the data going into the analysis is much more extensive than this, encompassing 24 types of measurements and analysis methodologies for the period from 1992 through to 2017.
“Whether Antarctic mass loss keeps worsening depends on choices made today”
Peter Neff, Postdoctoral research associate, University of Washington:
This is the biggest opportunity to add more depth to the analysis of this new Antarctic ice loss result. An important point here is that the human fingerprint on this Antarctic mass loss is still hard to identify. A 2013 assessment1 showed that expert opinion is „uncertain and undecided“ about whether recent ice sheet behavior simply reflects natural variability or is a response to human-caused climate change. This is essentially because our observations of ice sheet behavior are too short, 30 years at best for satellite observations of the ice sheet. This just meets the minimum definition of a „climatology“ with respect to the atmosphere, and we know that the ice sheet operates on longer timescales than the atmosphere (it is a big system to move!).
Although West Antarctica has been one of the fastest-warming places on the planet over the last 60 years (sparse weather records begin in 1957), as Steig et al showed in 20092 and Bromwich et al confirmed in 20133, how/whether this atmospheric warming has emerged from natural climate variability is less clear. It is also unclear how this warming trend will continue, as climate in West Antarctica is pushed around by Pacific Ocean-atmosphere variability. From ice core records we (myself and MANY others) have drilled and analyzed across this region we do not see recent anomalies exceeding variability over the last 2000 years4. From measurements of ice borehole temperatures in the same region, the ice itself directly records anomalous warmth over the last 50 years5.
Antarctic weather is known to be harsh but it is also some of the most variable on the planet. The human fingerprint of atmospheric warming has emerged everywhere else on the planet as early as about 200 years ago, but we are still waiting for it to clearly emerge in Antarctica (see Figure 2 in Abram et al, 20166). As Mooney explains, how much atmospheric warming comes to Antarctica largely depends on our carbon emission choices in the near-term.
In addition to all of this, the ice loss in West Antarctica is less driven by ocean warming as it is by increased delivery of relatively-warm deep ocean currents beneath ice shelves. This delivery is driven by the atmosphere; whether winds blow strong enough in the right direction to drive upwelling currents beneath Pacific-facing West Antarctic ice shelves. Decadal-scale variability of the Pacific Ocean-atmosphere system in turn affect the strength and position of these current-driving winds.
Summary: it’s very complicated but the Pacific Ocean is the beast to watch for future West Antarctic ice loss, in combination with the dynamics of Pine Island, Thwaites, and a few smaller glaciers (Smith, Kohler) along the Amundsen Sea coast of West Antarctica.
- 1-Bamber and Aspinall (2013) An expert judgement assessment of future sea level rise from the ice sheets, Nature Climate Change
- 2-Steig et al (2019) Warming of the Antarctic ice-sheet surface since the 1957 International Geophysical Year, Nature
- 3-Bromwich et al (2013) Central West Antarctica among the most rapidly warming regions on Earth, Nature Geoscience
- 4-Steig et al (2013) Recent climate and ice-sheet changes in West Antarctica compared with the past 2,000 years, Nature Geoscience
- 5-Orsi et al (2012) Little Ice Age cold interval in West Antarctica: Evidence from borehole temperature at the West Antarctic Ice Sheet (WAIS) Divide, Geophysical Research Letters
- 6-Abram et al (2016) Early onset of industrial-era warming across the oceans and continents, Nature
“[The West Antarctic Ice Sheet] is known to be losing ice rapidly because it is being melted from below by warm ocean waters, a process that is rendering its largest glaciers unstable.”
Peter Neff, Postdoctoral research associate, University of Washington:
This is accurate but doesn’t fully explain that the warm ocean water is not a result of human-caused climate change and it is not a linear warming of Southern Ocean waters that causes melt beneath West Antarctic ice shelves. Rather, it is variability in the delivery of this relatively warm water (called Circumpolar Deep Water) that can directly affect how much melt is happening. Delivery of this water is altered by the direction and strength of winds over the Amundsen Sea, a subset of the Pacific sector of the Southern Ocean. If winds blow from west to east across the Amundsen Sea, they promote upwelling of this deep water under ice shelves, promoting melt and hence increasing ice loss*.
- Steig et al (2012) Tropical forcing of Circumpolar Deep Water Inflow and outlet glacier thinning in the Amundsen Sea Embayment, West Antarctica, Annals of Glaciology
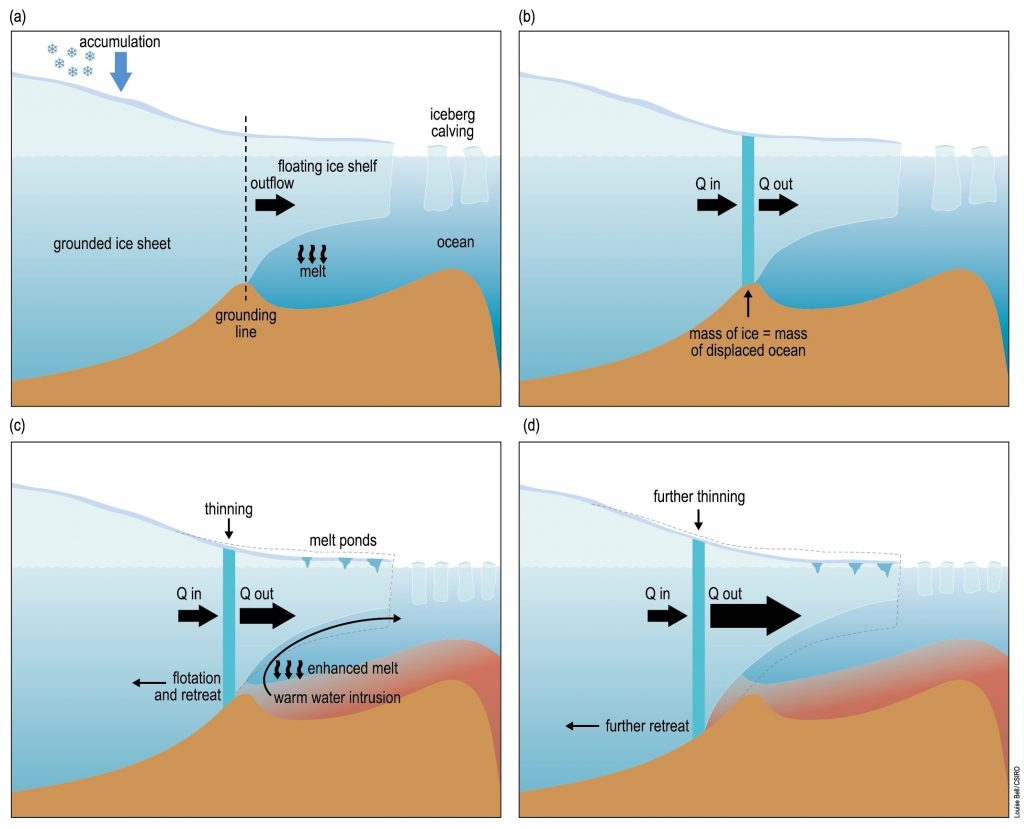
“The growth is largely attributable to just two huge glaciers — Pine Island and Thwaites. The latter is increasingly being viewed as posing a potential planetary emergency, because of its enormous size and its role as a gateway that could allow the ocean to someday access the entirety of West Antarctica, turning the marine-based ice sheet into a new sea.”
This is known as the Marine Ice Sheet Instability hypothesis (MISI), see Box 13.2 in the latest IPCC report (Working Group 1).

sheet, (b) the grounding line in steady state, (c) climate change triggering mass outflow from the ice sheet and the start of grounding line retreat and (d) self-sustained
retreat of the grounding line. Source: IPCC
“‘That isn’t going to sound horribly unmanageable. But remember for the northern hemisphere, for North America, the fact that the location in West Antarctica is where the action is amplifies that rate of sea level rise by up to an about additional 25 percent in a city like Boston or New York.’ That’s because as Antarctica’s mass shrinks, the ice sheet’s gravitational pull on the ocean relaxes somewhat, and the seas travel back across the globe to pile up far away — with U.S. coasts being one prime destination.”
Peter Neff, Postdoctoral research associate, University of Washington:
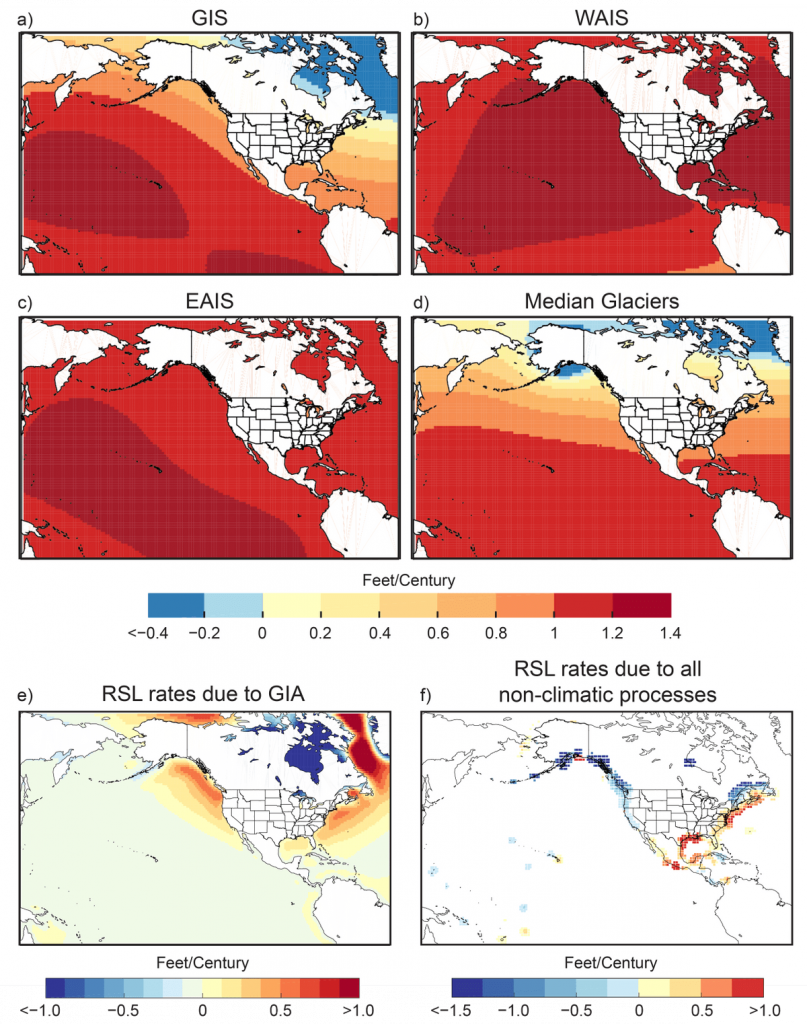
What Rob DeConto and Chris Mooney explain here are the „far-field“ sea level rise effects of losing so much concentrated ice mass in West Antarctica. This loss of mass reduces the gravitational pull that Antarctica otherwise has on the ocean, causing more water to slosh away from the far South. This just so happens to have a maximum impact on both coasts of North America, as illustrated in the Climate Science Special Report released in 2017 as part of the 4th National Climate Assessment undertaken by US federal agencies and universities. Figure 12.1 in the Sea Level Rise chapter shows that an extra 1.4 feet per century of relative sea level rise can be expected for North America (data originally from Kopp et al*), coming largely from the two largest West Antarctic glaciers—Pine Island and Thwaites Glaciers.

(Source: US NCA)
- Kopp et al (2014) Probabilistic 21st and 22nd century sea‐level projections at a global network of tide‐gauge sites, Earth’s Future
This effect is called the gravitational effect, and it is the consequence of one of the basic laws of physics: mass attracts mass. When mass is lost on Antarctica, sea level will fall within a 2,200 km radius due to the loss of gravitational pull. Between 2,200 and 7,600 km, sea level will rise but less than the global average. Beyond 7,600 km, sea level rise will be larger than the global mean, up to 25% extra. For Antarctica, this means that the largest consequences will be in the Northern Hemisphere, with the reverse being true for mass loss in Greenland.
The gravitational effect has been known since 18861, was rediscovered in 19762 and again in 20013. It is used in sea-level projections, for instance in the IPCC AR5 report, chapter 13.
- 1-Woodward (1886) On the form and position of the sea-level as dependent on superficial masses symmetrically disposed with respect to a radius of the Earth’s surface, Annals of Mathematics
- 2-Farrell and Clark (1976) On Postglacial Sea Level, Geophysical Journal International
- 3-Mitrovica et al (2001) Recent mass balance of polar ice sheets inferred from patterns of global sea-level change, Nature

