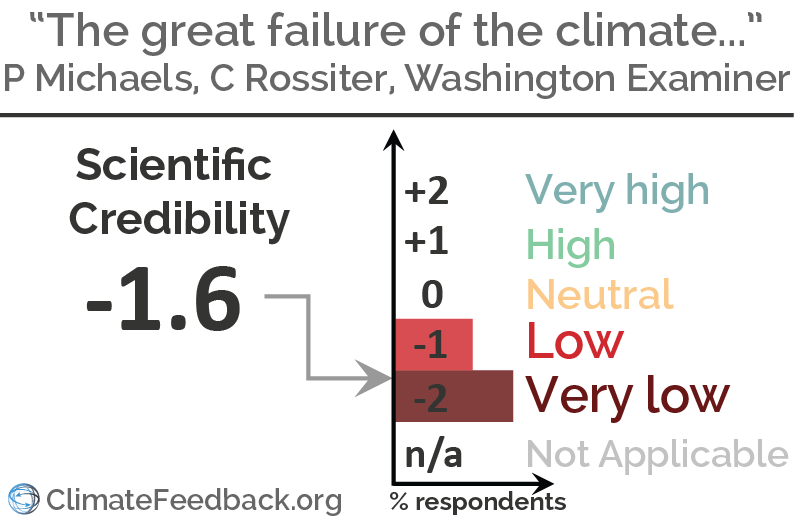
- Climate
Washington Examiner op-ed cherry-picks data and misleads readers about climate models
Reviewed content
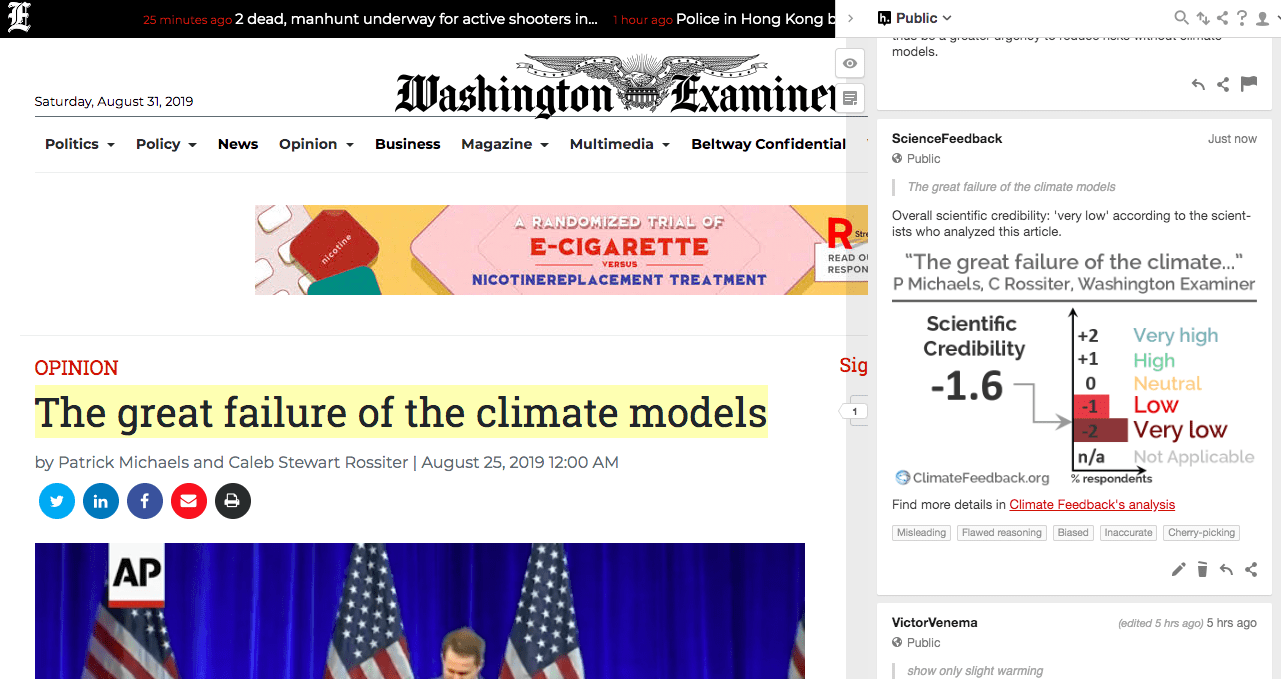
Headline: "The great failure of the climate models"
Published in The Washington Examiner, Zero Hedge, by Caleb Stewart Rossiter, Patrick Michaels, on 2019-08-25.
Scientists’ Feedback
SUMMARY
This op-ed article published by The Washington Examiner (and republished by Zero Hedge) claims to provide evidence that climate models are not valid scientific tools able to inform decisions about climate change by focusing on a comparison with specific datasets from the upper atmosphere in the tropics.
Scientists who reviewed the article found that it is highly misleading, including a number of false factual assertions, cherry-picking datasets that support their point, failing to account for uncertainties in those datasets, and failing to assess the performance of climate models in an objective and rigorous manner.
See all the scientists’ annotations in context. You can also install the Hypothesis browser extension to read the scientists’ annotations in context.
REVIEWERS’ OVERALL FEEDBACK
These comments are the overall assessment of scientists on the article, they are substantiated by their knowledge in the field and by the content of the analysis in the annotations on the article.

Research Scientist, Lawrence Livermore National Laboratory
This article focuses only on specific lines of evidence that climate models disagree with observations. In doing so, the authors ignore research that helps to reconcile differences between models and observations. The authors do not consider alternate datasets and time periods in which models and observations agree. Models are one tool for understanding climate change; their overall credibility does not hinge on one variable, in one domain, over a specific time period, with respect to a set of imperfect observations.

Senior Research Scientist, Remote Sensing Systems (RSS)
The article contains numerous inaccurate statements, and “cherry-picks” evidence to support its assertion about model accuracy.
The article exaggerates the disagreement between the modeled and observed trends in the tropical lower troposphere. Depending on which satellite data set is used, the model-mean trend (1979-2017) in the tropical (30S to 30N) lower tropospheric temperature is 1.73 (RSS dataset) or 2.38 (UAH dataset) times larger than the trends observed by satellites, not 7 times as stated in the article.
The article asserts that the satellite and radiosonde temperature records are more accurate than the surface temperature record. I consider this to be unlikely (even though I developed one of the satellite records) as indicated by the smaller spread in trends in the surface record than in the satellite record.
The article asserts that the rate of sea level rise has not increased. Recent papers have clearly shown an acceleration in sea level rise, both in satellite altimeter data1 and in a sea level rise reconstruction based on tide gauges2.
- 1- Nerem et al (2018) Climate-change–driven accelerated sea-level rise detected in the altimeter era, PNAS
- 2- Dangendorf et al (2019) Persistent acceleration in global sea-level rise since the 1960s, Nature Climate Change

Scientist, University of Bonn, Germany
The article makes a large number of claims which have long been known to be wrong. The authors’ ignoring of the counterarguments makes it clear that bypassing the scientific debate and going directly to the public is not helpful for a better understanding of climate change.
The main erroneous claim is that numerical climate models are wrong. Even if we would grant them that—or even if we did not have any models—it would still be clear that CO2 would warm the Earth, but we would know less-well how much it warms the Earth, and especially we would know much less about how this changes the rest of the climate system. (How this changes average and severe precipitation and in which regions, how this changes heat waves, the circulation, hurricanes, permafrost, etc.) The risks of climate change would thus be larger without climate models.

Research Associate, Colorado State University/NASA JPL
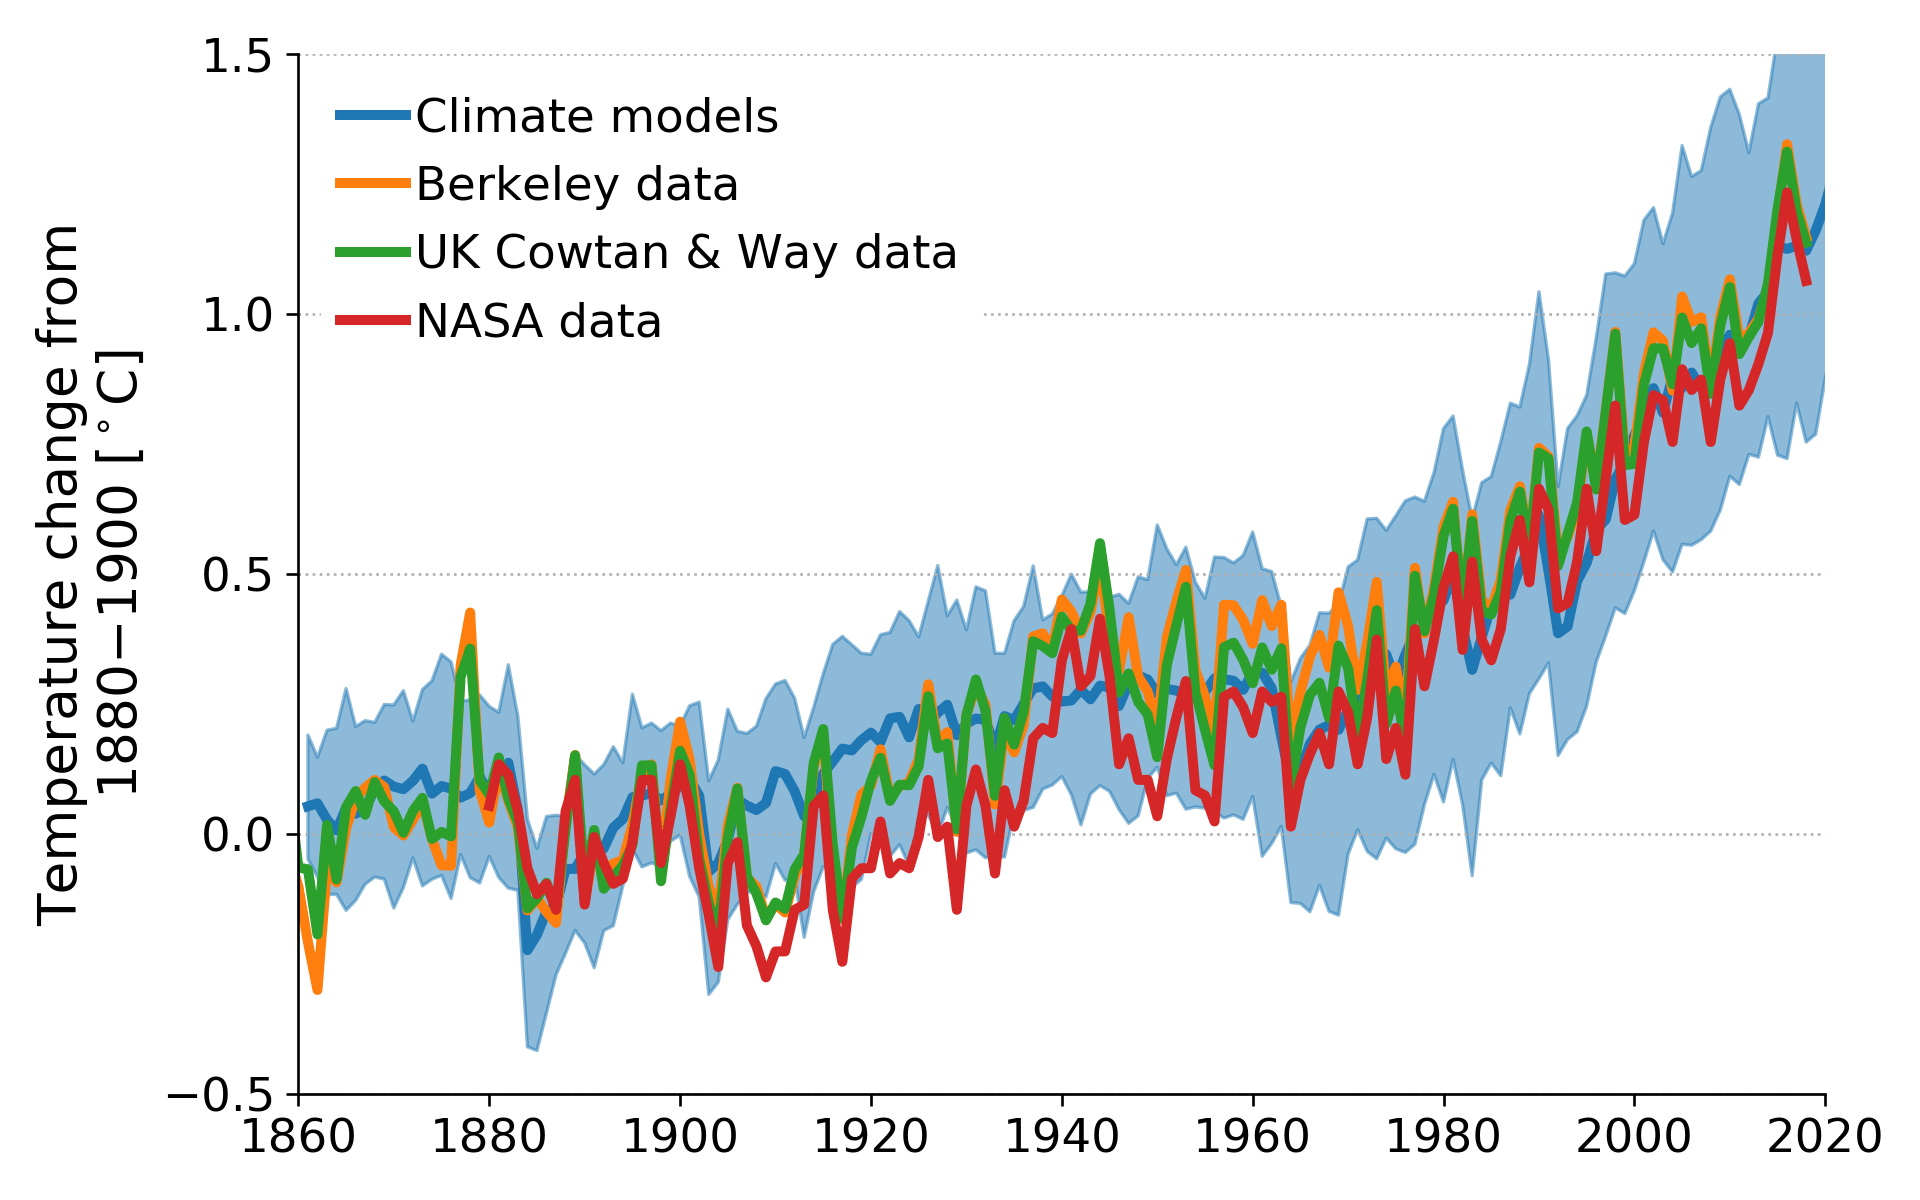
Measured global temperatures agree pretty well with climate model outputs since 18601 so why does this Washington Examiner article say the opposite?
The article’s major argument relies heavily on satellite-based datasets of atmospheric temperatures since the 1970s. These particular satellites were not designed for climate monitoring and unlike with other records, we currently lack enough independent checks of their reliability for climate trends. In the lower atmosphere, for example, processing by Remote Sensing Systems gives about 60% more warming than processing by the University of Alabama Huntsville, even though they use the same raw data. As the developer of a satellite dataset, the Examiner article’s claim that this is the “most reliable” data is not remotely believable to me.
The more-uncertain satellite series were preferred over the surface temperature data, based on the baseless accusation that the surface records are “badly compromised” by adjustments to the data, such as those to correct for changes in measurement times, locations and technology. On net, these adjustments shrank reported warming since the 1800s, but the Examiner article incorrectly claims the opposite: “…each serial adjustment has tended to [increase] the warming trend”.
One adjustment is done because nowadays there are more buoy temperature readings of the ocean, and scientists carefully combined this newer buoy data with older ship-based readings. The Examiner article says that the corrections involved “replacing satellite data with drifting buoys” (untrue) and that such a correction was “guaranteed to put some artificial warming in the data” (untrue, that’s not how the maths works). Independent infrared satellite readings confirm that the new corrections are good, though.2
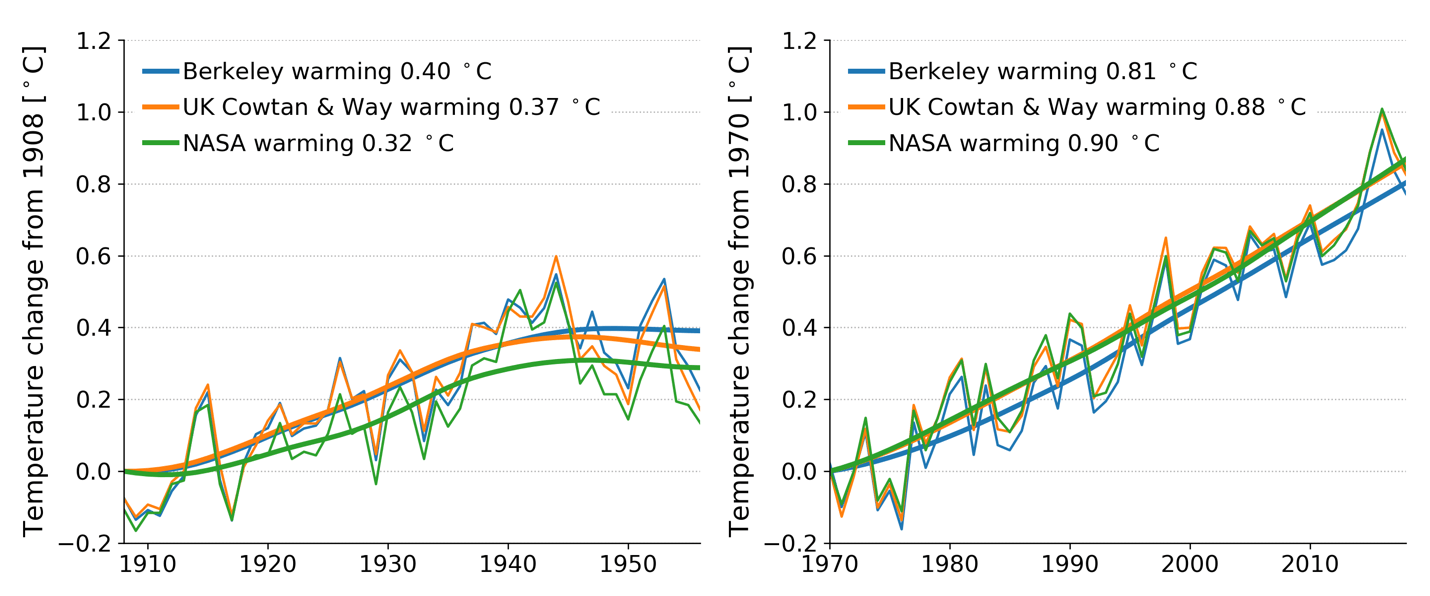
The Examiner article also talks about two warming periods: a “half-degree from…the first half of the 20th century” and “another half-degree in the last quarter of the century”. This misleads readers since the recent, ongoing warming is about 2-3 times larger than the earlier warming.
Later the Examiner cites a UN report by independent scientists to say the “latter half-degree is at least half manmade”, but that’s a bit like saying that the “latter half of the Superbowl is at least half manmade”. While technically true, it could prevent readers from realising that the best estimate is that effectively all of the recent warming is human-caused.
The Examiner article misleads in other areas too, such as its claims that measured Arctic warming “runs afoul of basic physics” and “adds non-existent warming” (untrue, about 4 Texas’ area of sea ice extent has melted since the 1970s and buoys and satellites also measure its rapid heating3,4,5).
In summary, this article’s conclusions rely heavily on a number of untrue statements, it relies on less-certain datasets and misses vital context.
- 1- Richardson et al (2016) Reconciled climate response estimates from climate models and the energy budget of Earth, Nature Climate Change
- 2- Hausfather et al (2017) Assessing recent warming using instrumentally homogeneous sea surface temperature records, Science Advances
- 3- Boisvert and Stroeve (2015) The Arctic is becoming warmer and wetter as revealed by the Atmospheric Infrared Sounder, Geophysical Research Letters
- 4- Susskind et al (2019) Recent global warming as confirmed by AIRS, Environmental Research Letters
- 5- Dodd et al (2014) An Investigation into the Impact of using Various Techniques to Estimate Arctic Surface Air Temperature Anomalies, Journal of Climate
Notes:
[1] See the rating guidelines used for article evaluations.
[2] Each evaluation is independent. Scientists’ comments are all published at the same time.
Annotations
The statements quoted below are from the article; comments are from the reviewers (and are lightly edited for clarity).
Computer models of the climate are at the heart of calls to ban the cheap, reliable energy that powers our thriving economy and promotes healthier, longer lives.
Research Scientist, Lawrence Livermore National Laboratory
Assessments of climate change include many lines of evidence. In addition to computer models, observations of many aspects of the climate (e.g. changes in land and sea ice, sea level rise, temperature, humidity, etc.) and paleoclimate evidence is considered.

Professor, Texas A&M University
No. Climate models are one source of information, but the basis of concern about climate change comes from our understanding of the fundamental physics of the atmosphere.
Scientist, University of Bonn, Germany
Also, without numerical computer models we have many lines of evidence that climate change is a problem (basic physics, observed changes, climatic changes in the deep past). The uncertainties and thus the risks would be higher. There would thus be a greater urgency to reduce risks without climate models.
[data] show only slight warming, mostly at night and in winter
Research Scientist, Lawrence Livermore National Laboratory
This is something that is also simulated in climate models (larger warming in the minimum daily temperature than the maximum daily temperature).
The article the authors reference tends to focus on smaller spatial scales where natural variability plays a larger role. On a global scale, the seasonal asymmetry in warming rates appears to be small. Taking global GISTEMP trends over 1950 – 2018 the range of trends for all seasons is 0.13 – 0.15 degrees C per decade.
- Lewis and Karoly (2013) Evaluation of Historical Diurnal Temperature Range Trends in CMIP5 Models, Journal of Climate
Scientist, University of Bonn, Germany
I would personally not call a warming of the global average temperature of 1°C “slight”, that is considerable warming with clear consequences.
there has been no systematic increase in the frequency of extreme weather events,
Research Associate, Colorado State University/NASA JPL
It’s not clear how you judge “systematic increase in the frequency of extreme weather”.
Since the 2013 UN IPCC report, we have new data and analysis showing increases in extreme heat and precipitation in many areas due to human-caused global warming. It is misleading not to mention this.
Professor, Texas A&M University
This is not true. We have good evidence that heat waves are occurring more frequently and that rainfall is falling in more intense events1. These are both things were predicted long ago to occur with global warming.
- 1- State of the Climate in 2018, Bulletin of the American Meteorological Society
Research Scientist, Lawrence Livermore National Laboratory
This is not as universally true as suggested in this op-ed. Changes in extreme events are difficult to detect and depend on definition and region, but there is evidence for some changes in extreme weather events. For example, evidence is provided for decreases in cold nights, increases in warm days, and increases in heavy precipitation over North America1.
- 1- IPCC (2013) Climate Change 2013: The Physical Science Basis (Ch. 2, p. 162)
Senior Research Scientist, Remote Sensing Systems (RSS)
Key Finding from the 4th US National Climate Assessment: “Heat waves have become more frequent and intense, especially in the West. Cold waves have become less frequent and intense across the nation. There have been regional trends in floods and droughts. ”
the ongoing rise in sea level that began with the end of the ice age continues with no great increase in magnitude.
Research Associate, Colorado State University/NASA JPL
It misleads readers not to mention the research suggesting accelerated global sea level rise1.
While the authors may think a 50-100% acceleration of sea level rise is “no great increase”, readers may misunderstand this.
- 1- Dangendorf et al (2019) Persistent acceleration in global sea-level rise since the 1960s, Nature Climate Change
Research Scientist, Lawrence Livermore National Laboratory
This is at odds with recent work that finds a “persistent acceleration in global mean sea level rise since the 1960s”1 and the IPCC’s attribution of sea level rise2:
“It is very likely that there is a substantial contribution from anthropogenic forcings to the global mean sea level rise since the 1970s. It is likely that sea level rise has an anthropogenic contribution from Greenland melt since 1990 and from glacier mass loss since 1960s. Observations since 1971 indicate with high confidence that thermal expansion and glaciers (excluding the glaciers in Antarctica) explain 75% of the observed rise.”
- 1- Dangendorf et al (2019) Persistent acceleration in global sea-level rise since the 1960s, Nature Climate Change
- 2- IPCC (2013) Climate Change 2013: The Physical Science Basis (p. 870)
Senior Research Scientist, Remote Sensing Systems (RSS)
Acceleration is also seen in data from satellite altimeters1.
- 1- Nerem et al (2018) Climate-change–driven accelerated sea-level rise detected in the altimeter era, PNAS
Let’s find out by comparing the actual temperatures since 1979 with what the 32 families of climate models used in the latest U.N. report on climate science predicted they would be.
Research Scientist, Lawrence Livermore National Laboratory
Considering a larger range of time, Marotzke and Forster (2015)1 generally find good consistency between models and observations.
- 1- Martozke and Forster (2015) Forcing, feedback and internal variability in global temperature trends, Nature
Atmospheric scientist John Christy developed a global temperature record of the lower atmosphere using highly accurate satellite soundings.
Research Scientist, Lawrence Livermore National Laboratory
The authors are referring to microwave sounding instruments, which provide a measure of tropospheric temperature changes. These records are useful, but have substantial uncertainty.
In the State of the Climate Report1, various estimates of tropical tropospheric warming had a range of 0.12 – 0.22 K / decade across four datasets (that all use the same underlying satellite data). This is nearly a factor of two difference in the long-term rate of warming. This “structural uncertainty” results because researchers use different approaches to remove known biases that affect long-term trends. No method is perfect, which leads to widely varying estimates of atmospheric warming.
- 1- Christy et al (2019): Tropospheric Temperature [in “State of the Climate in 2018”], Bulletin American Meteorological Society
Scientist, University of Bonn, Germany
This is one of the least reliable warming estimates available. These satellites were not developed to measure temperature, but humidity. The data processing by Christy amplifies measurement uncertainties and several serious errors in the data processing have been found by colleagues. The most serious problem found up to now was not taking into account the orbital decay of the satellites.
since 1979 to the most reliable observations — those made by satellites and weather balloons over the vast tropics.
Research Associate, Colorado State University/NASA JPL
These are not the “most reliable” observations. They have the largest issues with lack of independent data to check against, and different groups come up with temperature trends that are far more different than the surface temperature records.
Professor, Texas A&M University
These are hardly the most reliable measurements. For a description of the tortured history of the satellite measurements, see page 8 of this document.
In fact, the surface temperature record is much more reliable and the models agree well with it. It’s as likely that unresolved errors in the satellite record are responsible for the errors as problems in the models.
Research Scientist, Lawrence Livermore National Laboratory
Beware of cherry-picking: It is not established that satellites are the “most reliable” observations, that the tropics are the best domain with which to compare observations or models, or that we should only consider post-1979 satellite era data.
Scientist, University of Bonn, Germany
This plot hides the large differences between these highly uncertain estimates by only showing the average.
the models predicted seven times as much warming as has been observed
Research Scientist, Lawrence Livermore National Laboratory
The op-ed authors reference the 2017 State of the Climate Report. I helped prepare the “Lower and Mid-Tropospheric Temperature” section and it is unclear where the authors’ statistic comes from (“seven times as much warming…”).
The average CMIP5 model warming in the tropical troposphere does outpace observations (by a factor of 1.5 – 3.3, depending on dataset). This issue deserves (and has received) scrutiny.1,2,3,4,5,6
The difference in warming rates between observations and models largely arises in the early 2000s. A number of assessments have concluded that this slowdown in warming in the 2000s is in part due to natural variability (the Earth’s warming was slowed due to climate variability) and forcing (the real world experienced different solar and volcanic aerosol forcing than what was used in the models). Models do simulate natural “hiatus” periods like that experienced in the early 2000s, but, since they are random, they generally do not occur at the same times as in the real world (though some models happened to have a slowdown in warming in the early 2000s). Furthermore, forcing agents (greenhouse gases, aerosols, solar changes) are prescribed to models. Since we do not know the exact evolution of forcing agents for future projections, they are estimated. In this case, the estimated forcing was different than what occurred in the real world.
When these issues are taken into account, models and observations are in agreement. Over long periods, when natural variability is a smaller issue, models and observations agree on the rate of warming. Assessments of model projections of climate change show that models have typically been quite skillful (e.g. here).
- 1- IPCC (2013) Climate Change 2013: The Physical Science Basis (Ch. 9, Box 9.2)
- 2- Meehl et al (2014) Climate model simulations of the observed early-2000s hiatus of global warming, Nature Climate Change
- 3- Gleisner et al (2015) Recent global warming hiatus dominated by low‐latitude temperature trends in surface and troposphere data, Geophysical Research Letters
- 4- Medhaug et al (2017) Reconciling controversies about the ‘global warming hiatus’, Nature
- 5- Santer et al (2017) Comparing Tropospheric Warming in Climate Models and Satellite Data, Journal of Climate
- 6- Santer et al (2017b) Causes of differences in model and satellite tropospheric warming rates, Nature Geoscience
on average, the projected heating by the models is three times what has been observed.
Research Scientist, Lawrence Livermore National Laboratory
As suggested in the last comment this statistic is quite uncertain (1.5 – 3.3). Some climate models simulate less warming than some satellite datasets. The reason that the average of the CMIP5 models exhibits more warming than observations is in part due to natural variability and problems with the forcing (aerosols, solar changes, etc.) in the models.
This is a critical error. Getting the tropical climate right is essential to understanding climate worldwide.
Professor, Texas A&M University
This is only a critical error because they’re desperate to discredit the models. If the disagreement were in the polar regions, they’d be talking about how important it is to get the polar regions right. Obviously, you want to get everything right, but we live on the surface, so getting that right is the most important—and the models do that.
Scientist, University of Bonn, Germany
So apparently the previous paragraph is not just about the upper atmosphere at around 10 km height, but also just about the tropics. That is a tiny remote part of the climate.
Most of the atmospheric moisture originates in the tropical ocean, and the difference between surface and upper atmospheric temperature determines how much of the moisture rises into the atmosphere.
Research Scientist, Lawrence Livermore National Laboratory
The relative warming between the surface and the troposphere in both models and observations is in accord with our physical understanding of the tropical atmosphere.1
- Po-Chedley et al (2015) Removing Diurnal Cycle Contamination in Satellite-Derived Tropospheric Temperatures: Understanding Tropical Tropospheric Trend Discrepancies, Journal of Climate
Senior Research Scientist, Remote Sensing Systems (RSS)
Satellite-observed increases in atmospheric moisture content agree with satellite datasets that show more warming.1
- 1- Mears et al (2015) Intercomparison of total precipitable water measurements made by satellite-borne microwave radiometers and ground-based GPS instruments, Journal of Geophysical Research
Globally averaged thermometers show two periods of warming since 1900: a half-degree from natural causes in the first half of the 20th century, before there was an increase in industrial carbon dioxide that was enough to produce it, and another half-degree in the last quarter of the century.
Research Associate, Colorado State University/NASA JPL
The earlier warming (~0.3-0.4 °C) is about a third to a half of the warming since the 1970s (0.8-0.9 °C). They are not comparable, and selecting “the last quarter” of the 20th century to ignore the warming since 2000 misleads readers.
Secondly, human activity was sufficient to cause warming in the first half of the 20th century.
Scientist, University of Bonn, Germany
To be clear, that is half a degree Celsius, a full degree Fahrenheit.
The latest U.N. science compendium asserts that the latter half-degree is at least half manmade.
Senior Research Scientist, Remote Sensing Systems (RSS)
The recent US National Climate Assessment1 finds that it is extremely likely that more than half of the temperature rise since 1951 is human-caused, and the likely human contribution is 93% to 123%. More than 100% means that the human caused warming would be higher, except that other unrelated changes caused cooling that partially offset the warming.
1- Fourth National Climate Assessment (2018) Part 1, Chapter 3
Scientist, University of Bonn, Germany
The best estimate is that all of the warming is man-made.
The first adjustment changed how the temperature of the ocean surface is calculated, by replacing satellite data with drifting buoys and temperatures in ships’ water intake.
Research Associate, Colorado State University/NASA JPL
This isn’t what happened. Satellite data was not replaced, it was never there in the first place.
Independent satellite data confirmed that the new corrections are solid.1
- 1- Hausfather et al (2017) Assessing recent warming using instrumentally homogeneous sea surface temperature records, Science Advances
But the thermometer records showed that the warming stopped from 2000 to 2014. Until they didn’t. In two of the four global surface series, data were adjusted in two ways that wiped out the “pause” that had been observed[…]
Professor, Texas A&M University
This section completely misrepresents the efforts to produce a global-average temperature data set. There are 4 scientific groups producing 4 independent records. They all agree and most of them post their code, so you can see exactly how they do the calculation—there’s certainly nothing nefarious going on.
There are adjustments to correct for known issues in the data, but they don’t have much of an effect on the global average temperature record.
The warming of the surface record is supported by many independent data: loss of ice all over the globe, warming of the ocean, sea level rise, and, yes, there’s reasonable agreement between the satellite and surface temperature records (see Table 2.3 of the 2018 State of the Climate report1).
- 1- State of the Climate in 2018, Bulletin of the American Meteorological Society
Scientist, University of Bonn, Germany
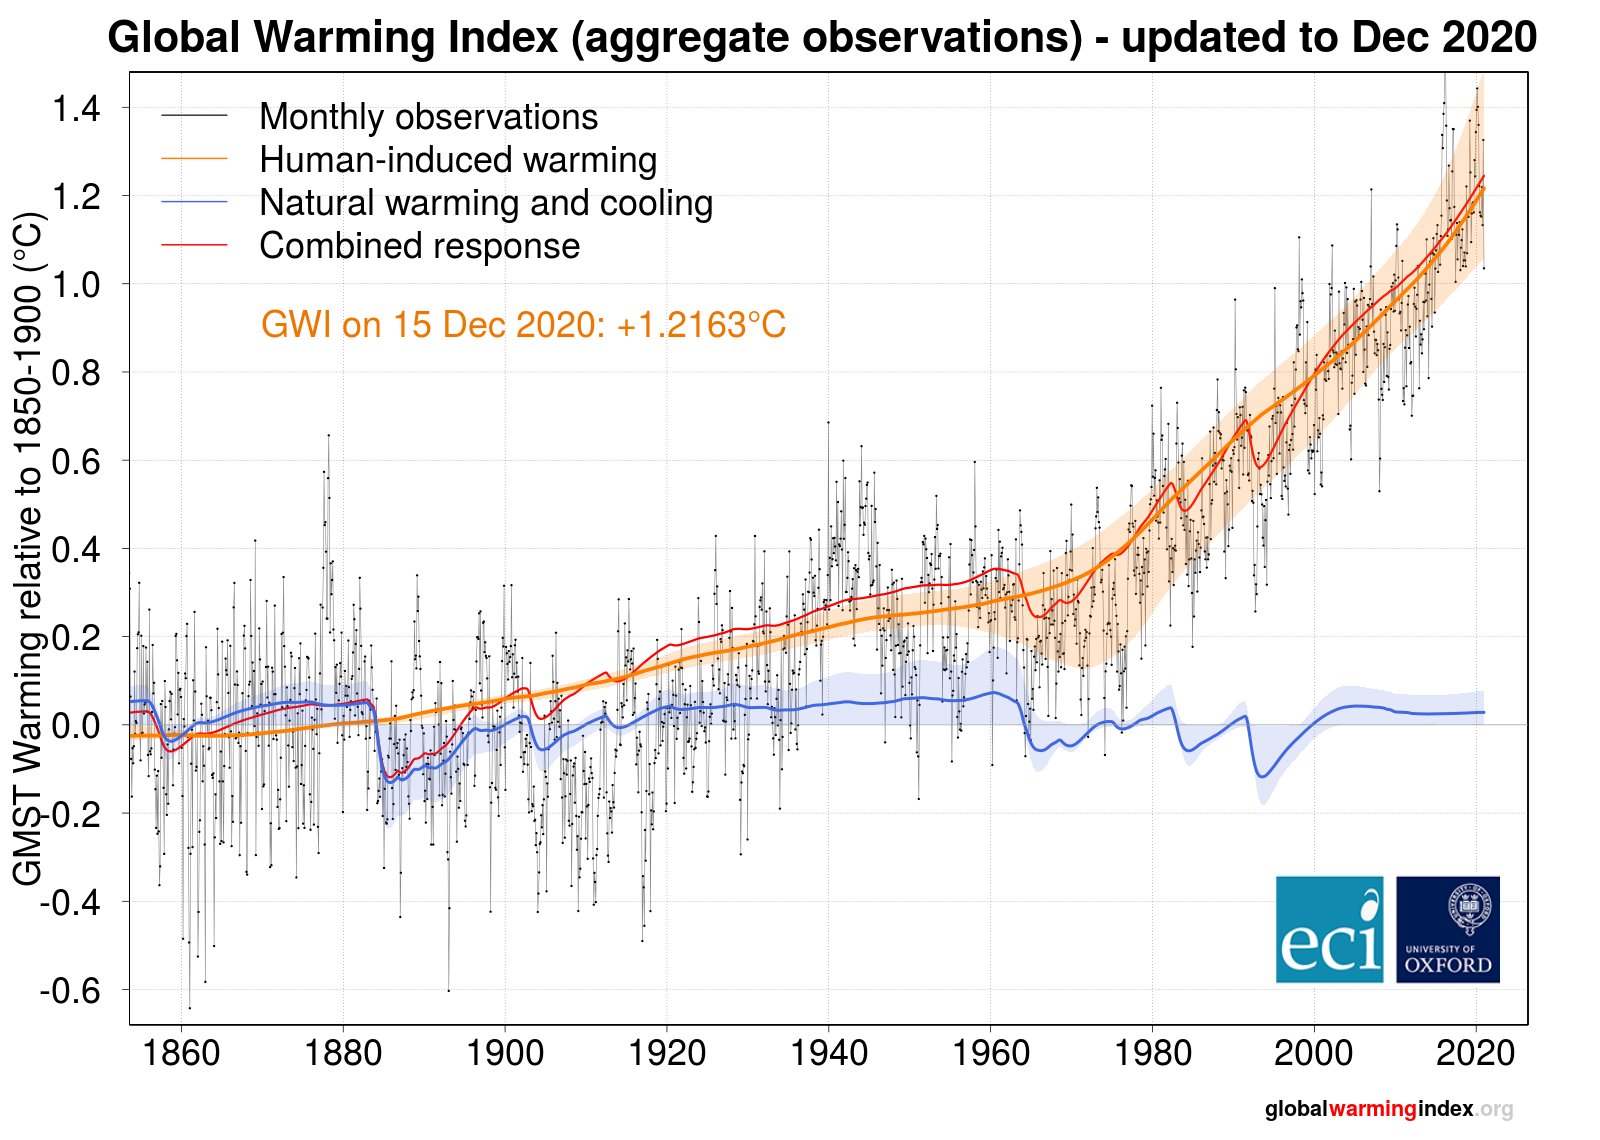
I had not expected anyone daring to use this argument in 2019. Especially nowadays, you do not need statistics to clearly see that global warming has simply continued. See warming estimate below.
The buoy temperatures, which are measured by precise electronic thermistors, were adjusted upwards to match the questionable ship data. Given that the buoy network became more extensive during the pause, that’s guaranteed to put some artificial warming in the data.
Research Associate, Colorado State University/NASA JPL
The direction of this adjustment does not affect the trends. This has been repeatedly checked and is well known. While the article says “that’s guaranteed to put some artificial warming in the data”, it’s actually guaranteed not to do that. Because mathematics.
This runs afoul of basic physics.
Research Associate, Colorado State University/NASA JPL
Sure, over ice the surface is limited in how much it can warm.
Satellite data and buoys confirm that the Arctic is warming and that the data records needed updating1,2,3.
- 1- Boisvert and Stroeve (2015) The Arctic is becoming warmer and wetter as revealed by the Atmospheric Infrared Sounder, Geophysical Research Letters
- 2- Susskind et al (2019) Recent global warming as confirmed by AIRS, Environmental Research Letters
- 3- Dodd et al (2014) An Investigation into the Impact of using Various Techniques to Estimate Arctic Surface Air Temperature Anomalies, Journal of Climate
The second big adjustment was over the Arctic Ocean
Scientist, University of Bonn, Germany
This is not an adjustment. Some temperature datasets did not include parts of the Arctic in their estimates of the global mean temperature. Because the Arctic warmed much in this period, these datasets showed less short-term warming. This was taken into account in their uncertainty estimates, which should have been taken into account by people wrongly claiming global warming had stopped between 2000 and 2014.
there’s plenty of ice over much of the Arctic Ocean. Now, for example, when the sea ice is nearing its annual minimum, it still extends part way down Greenland’s east coast.
Research Associate, Colorado State University/NASA JPL
There’s still about 5 million sq km of ocean where >15 % is ice covered, but that’s down by ~3 million sq km (4 Texases, if you will). Even if there’s still ice near Greenland.
But each serial adjustment has tended to make the early years colder, which increases the warming trend.
Research Associate, Colorado State University/NASA JPL
While this says that adjustments increase the total warming, they actually decrease it since the 1800s.
Professor, Texas A&M University
This is absolutely wrong. The adjustments to the global average warming REDUCE the trend, not increase it.
Shelters in poorer countries are not repainted as often, and darker stations absorb more of the sun’s energy.
Scientist, University of Bonn, Germany
This argument would only make sense if the authors assume that these shelters are a century old and never were painted in that time.
It’s no surprise that poor tropical countries show the largest warming from this effect.
Scientist, University of Bonn, Germany
This wrong claim may be the clearest example of why it is a problem that Michaels and Rossiter bypass science and go directly to the public with this article.
The statistical analysis in the article they link to is wrong and this has been known since at least 2009.
All this is to say that the weather balloon and satellite temperatures used in Christy’s testimony are the best data we have, and they show that the U.N.’s climate models just aren’t ready for prime time.
Research Scientist, Lawrence Livermore National Laboratory
The consistency of the surface records and the well-documented, large uncertainty in weather balloon and satellite datasets suggests that this is not true.
Senior Research Scientist, Remote Sensing Systems (RSS)
Also, there are large areas of the tropical oceans with almost no weather balloon observations, including the eastern Tropical Pacific.
Professor, Texas A&M University
The climate models do a good job in the most important parameter: surface temperature. They’ve also made many many other successful predictions which have been borne out by observations, such as changes in extreme precipitation. Overall, the models have been a lot more successful than unsuccessful.
Whether they’re good enough for guiding policy is not a scientific judgment but a political one. Given the models’ success at reproducing the surface record and the sketchy history of the satellite data, one could reasonably conclude that the models can and should be used to guide policy.
If, on the other hand, you want to wait until the models are perfect, which the authors of this article apparently want to do, then you’ll never take action to address climate change.