- Climate
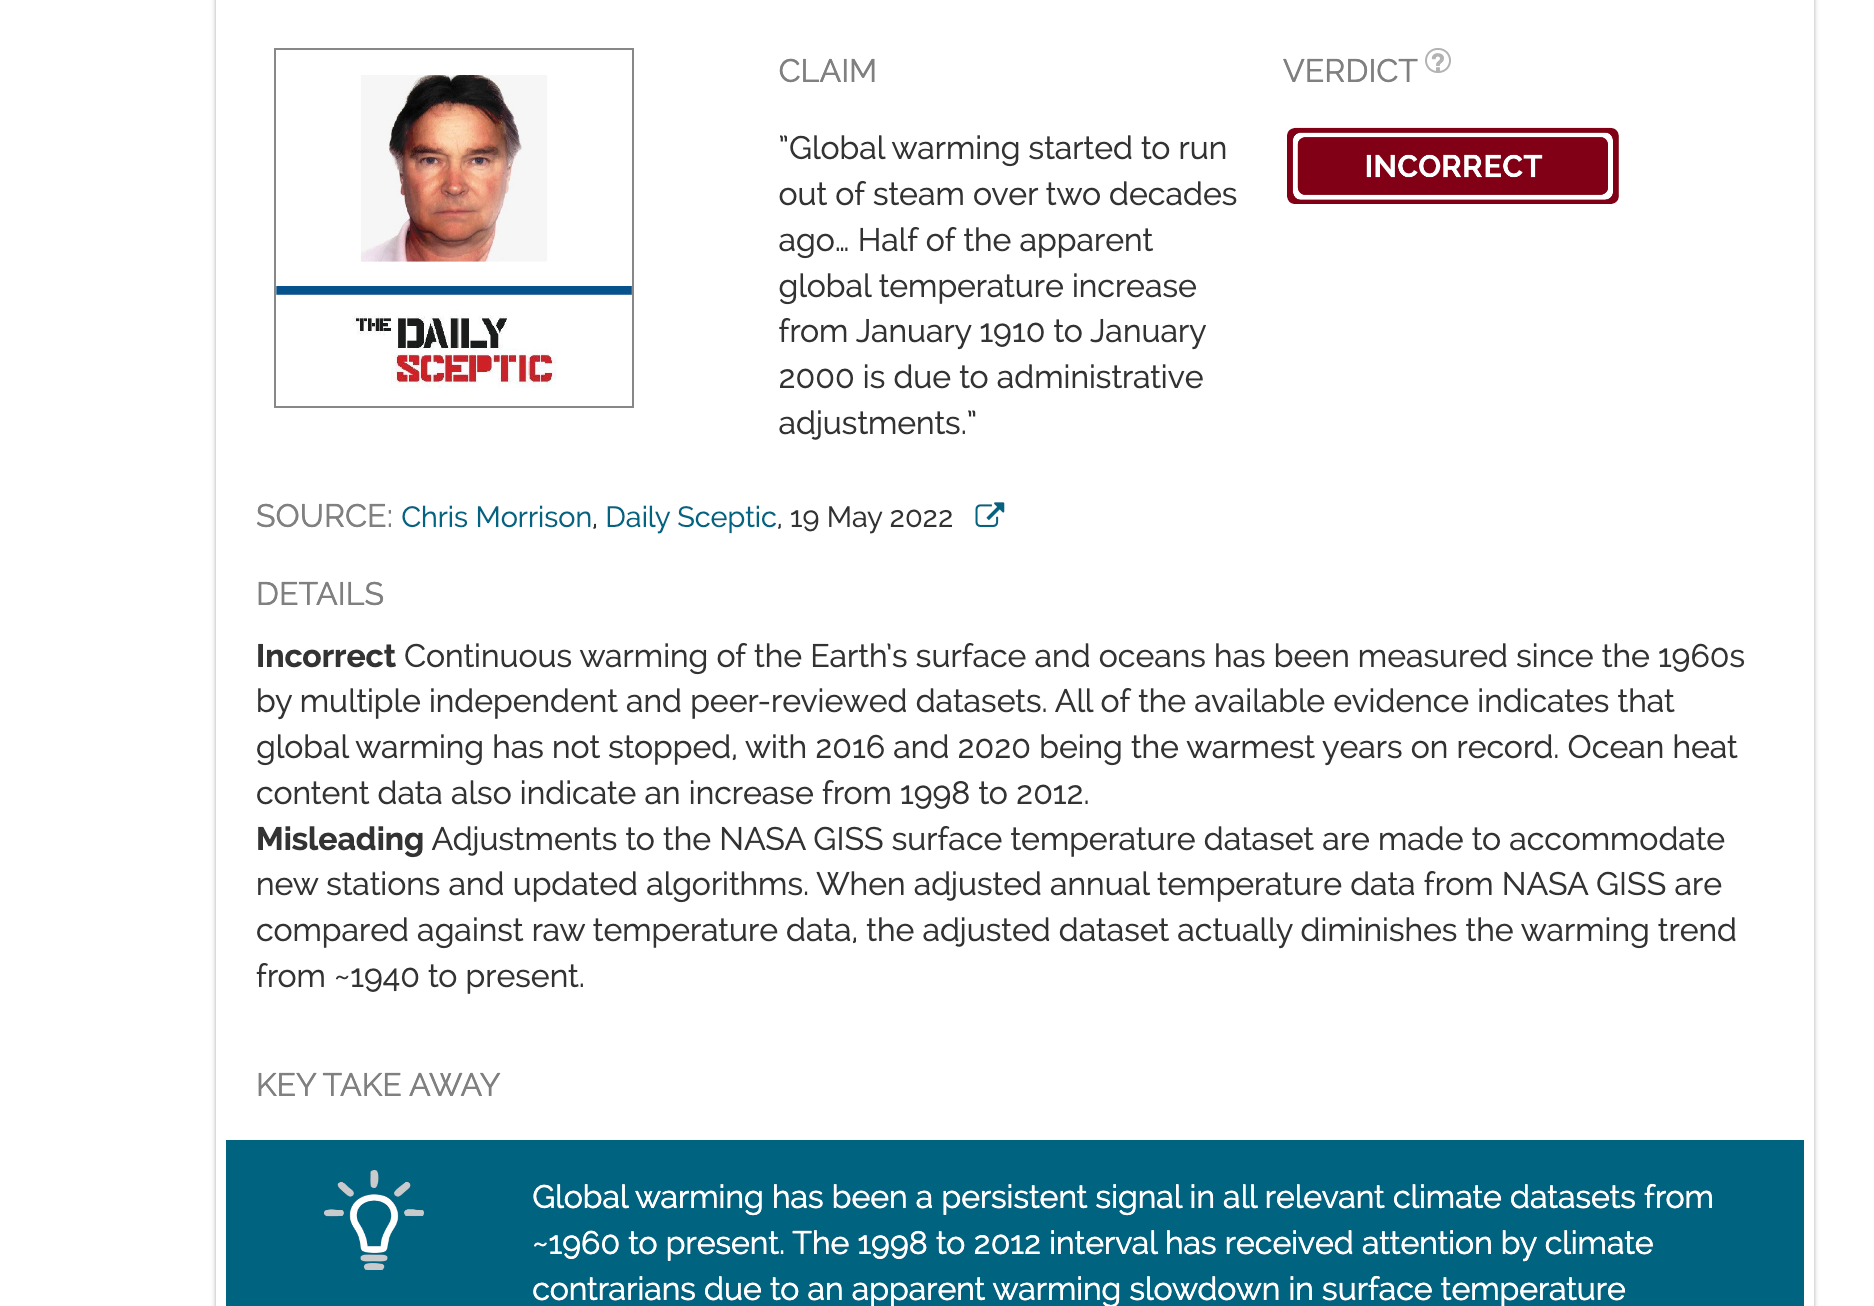
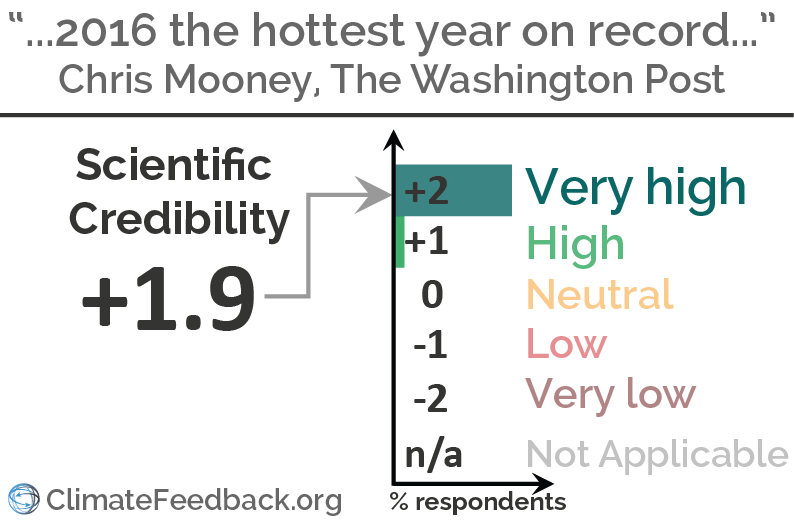
Analysis of "U.S. scientists officially declare 2016 the hottest year on record. That makes three in a row."
Reviewed content
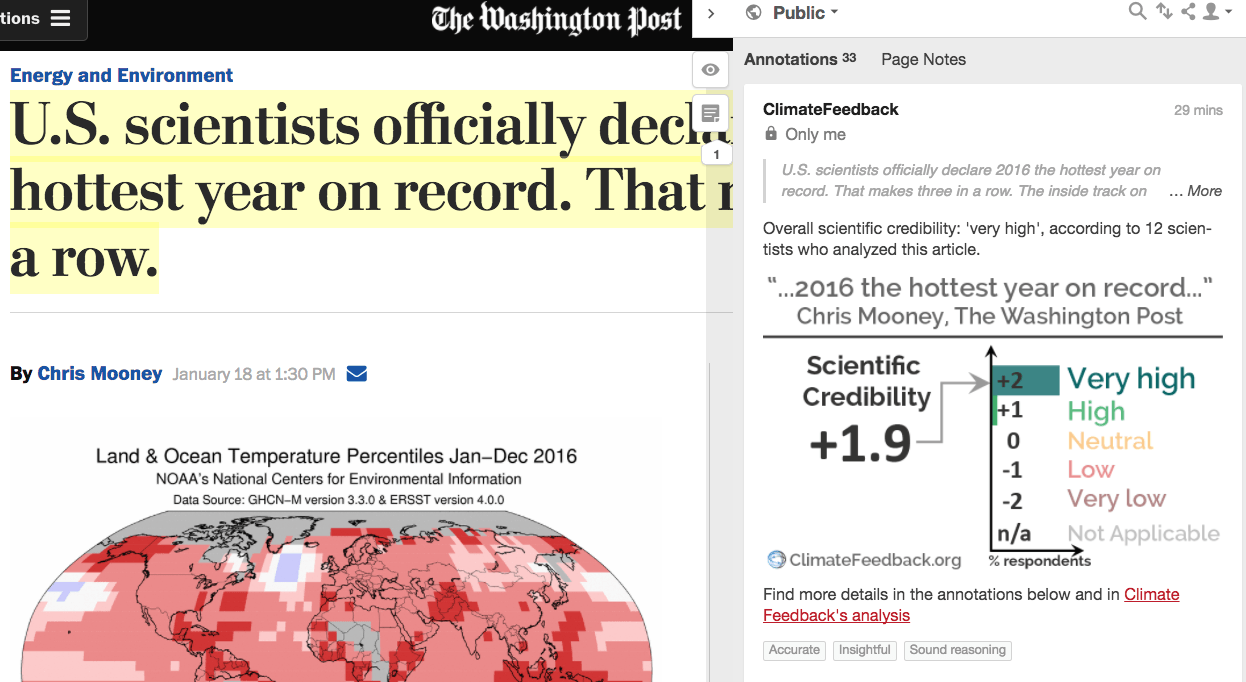
Published in The Washington Post, by Chris Mooney, on 2017-01-18.
Scientists’ Feedback
SUMMARY
On January 18th, NOAA and NASA released their annual assessment of the state of the global climate, including the fact that 2016 was the warmest year on record. The Washington Post article discusses the degree of confidence in this result, the factors contributing to the new record, and some of the ways in which different regions were impacted by this warmth.
Scientists found this article accurate and insightful in that it provides the context necessary to understand the significance of this new temperature record. It correctly notes that the record can be tied to human influence on the climate, even though El Niño played a role in further boosting the global temperature.
See all the scientists’ annotations in context
REVIEWERS’ OVERALL FEEDBACK
These comments are the overall opinion of scientists on the article, they are substantiated by their knowledge in the field and by the content of the analysis in the annotations on the article.

Associate Professor, University of Exeter
The article accurately conveys the US agencies’ declaration of 2016 as the hottest year on record. It provides some good background material on why the agencies’ numbers differ slightly (treatment of the Arctic) and the contributing roles of El Niño and man-made global warming.

Scientist, Coordinator of NOAA’s Coral Reef Watch, National Oceanic and Atmospheric Administration
The article accurately depicted the new data released by NOAA and NASA and used appropriate and valid scientific quotes to place the news in context. It also went beyond the simple temperature analysis to discuss some of the significant impacts felt in various parts of the world this year.
Climate Scientist, University of California, Los Angeles


Research Scientist, SciSpace LLC, NASA Goddard Institute for Space Studies
This is a useful summary of the key points outlined by NASA and NOAA, discussing the proximate causes of the 2016 warmth compared to surrounding years (mostly El Niño), and also that there is a sharp upward trend upon which natural variability is superimposed.

Research fellow, University of Melbourne
This article accurately describes why 2016 was record-breaking and makes insightful comments about the causes for differences between datasets.

Director of Climate and Energy, The Breakthrough Institute
An excellent overview of 2016 temperatures, with some detailed exploration of the differences between NOAA and NASA records. The only thing I might have added is some discussion of satellite tropospheric temperatures.

Professor, Victoria University of Wellington
An excellent summary, drawing on several leaders in the field of climate science.

Assistant Professor, University of Southern California
Chris Mooney reads what scientists say and reports on it without hyperbole or distortion. Thermometers and sea ice have no political agenda, and this article does a good job of summarizing the most recent evidence and scientific analyses based on them.

Postdoctoral Researcher, GFZ Helmholtz Centre Potsdam
Balanced descriptions of different datasets, and used explanations from scientists in appropriate places very well.

Scientist, University of Bonn, Germany
Great article, accurate in detail (the reasons for fluctuations and for differences between datasets) while keeping sight of the big picture (the long-term trend due to man-made global warming).
The article provides a good evaluation of the record year 2016 by including data from different datasets and agencies. It not only discusses the global mean temperature record, but also notable events such as the Arctic sea ice low. All of this combined, it shows that the big picture is clearer than ever.
Notes:
[1] See the rating guidelines used for article evaluations.
[2] Each evaluation is independent. Scientists’ comments are all published at the same time.
Key Take-aways
The statements quoted below are from the article; comments and replies are from the reviewers.
“ NASA concurred with NOAA, also declaring 2016 the warmest year on record in its own data set that tracks the temperatures at the surface of the planet’s land and oceans, and expressing ‘greater than 95 percent certainty’ in that conclusion. (In contrast, NOAA gave a 62 percent confidence in the broken record.) ”
Scientist, University of Bonn, Germany
The difference between NOAA and NASA-GISS is because of the way the Arctic—where much of the warming was in 2016, but where we do not have many measurements—is treated. NOAA excludes much of the Arctic, which gives it a cool bias in 2016, which is accounted for by a larger uncertainty.
NOAA. The gray areas are where NOAA’s methods do not have enough observations to compute the temperature. Not computing a temperature is similar to assuming these regions warm like the global average, but the Arctic warmed more.
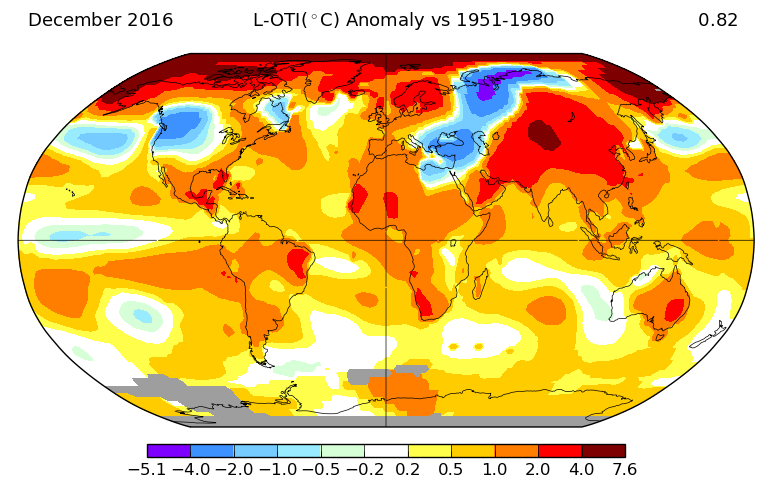
GISTEMP of NASA-GISS uses other mathematical methods and does compute temperatures for the Arctic, which results in a more accurate global average.
“Two other global agencies, the Japan Meteorological Agency and Britain’s Hadley Center, also track global temperatures.”
Director of Climate and Energy, The Breakthrough Institute
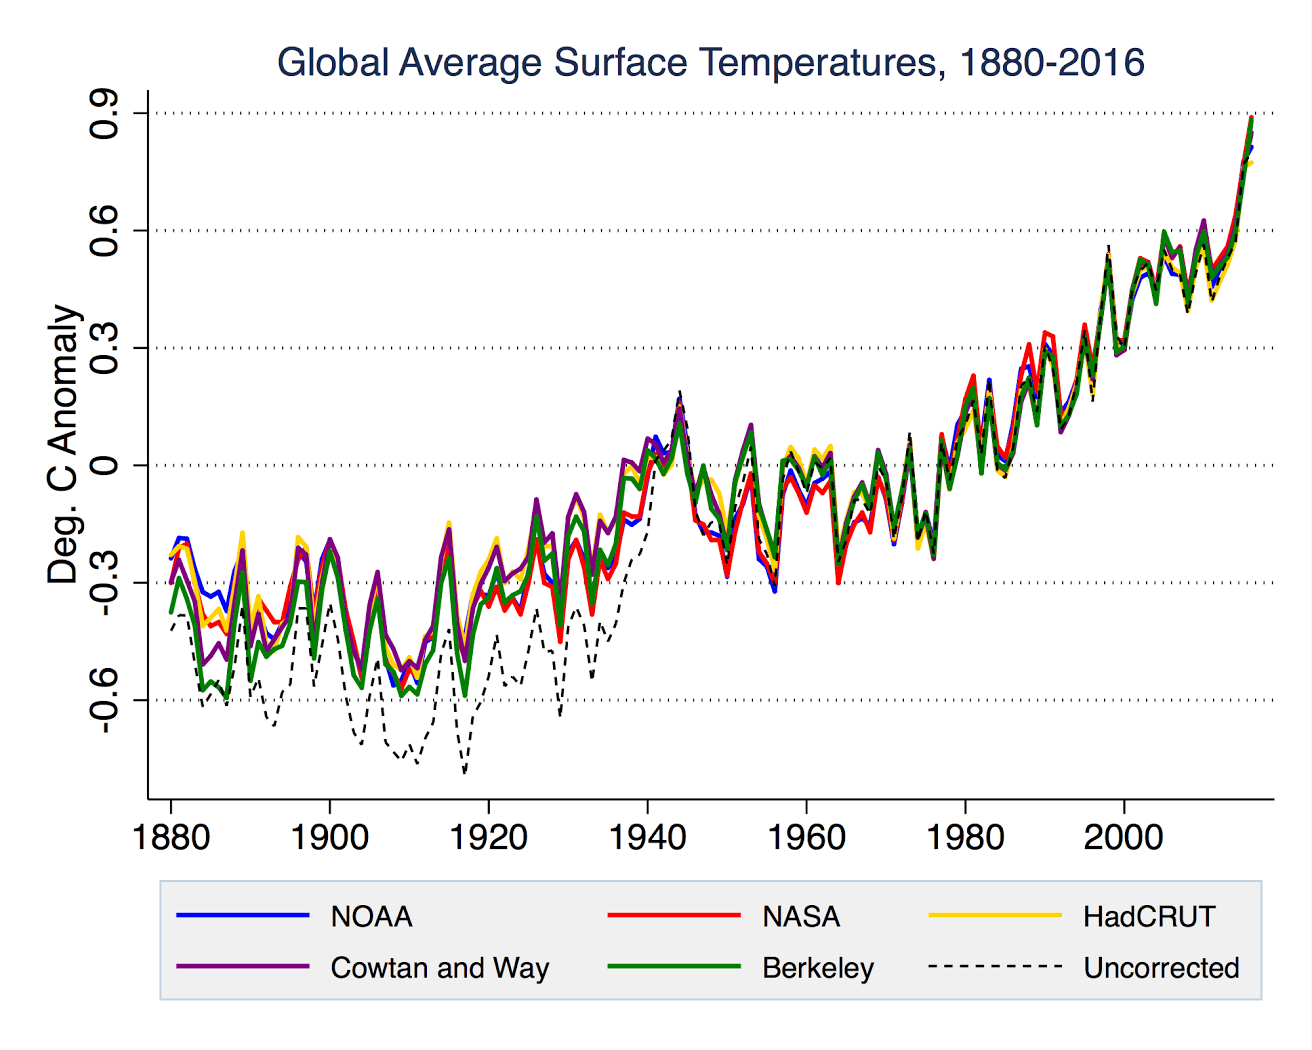
Other groups, including Berkeley Earth and Cowtan and Way, also agree that 2016 was a record warm year. It’s also a record warm year when you look at raw ocean and land data with no corrections or adjustments.
“But the differences between NOAA and NASA aren’t that significant, Schmidt further argued, in the context of the bigger picture. ‘Getting hung up on the exact nature of the records is interesting, and there’s lots of technical work that can be done there, but the main take-home response there is that the trends we’ve been seeing since the 1970s are continuing and have not paused in any way,’ he said.”
Climate Scientist, University of California, Los Angeles
This section accurately portrays the overall context of the 2016 record, and the fact that the modest differences between datasets do not change the “big picture” conclusion that the Earth is warming and that 2016 was an extraordinary year even in that context.
“[Jonathan Overpeck:] ‘No doubt about it anymore — humans, mainly by burning fossil fuels, are cooking the planet,’ Overpeck said.”
There is indeed a vast body of literature on ”detection and attribution” showing how the increase of greenhouse gases can be linked to changes in the climate system. Already in the most recent IPCC report this was shown for quantities such as surface temperature, ocean temperature, global mean sea level rise, Arctic sea ice loss, and glacier and ice sheet mass loss. Publications since have confirmed these findings.
“[Jonathan Overpeck:] ‘it is caused by humans’”

Lecturer, Bangor University, Wales, UK
The usual method of prying apart the various factors responsible for temperature changes is by modelling; we know the input of the Sun, we know the composition of the atmosphere, etc. If you have a climate model that, with these parameters, can reproduce the climate of the past, you can be fairly sure that, even being by definition a simplification, it gets the physics right. You can then use the model to calculate what the influence of each individual parameter was*. You can even switch parameters on and off to see what happens. These models can then also be used for climate predictions under various assumptions on, say, greenhouse gas emissions.
- Huber and Knutti (2012) Anthropogenic and natural warming inferred from changes in Earth’s energy balance, Nature Geoscience
“‘This El Niño might have contributed about a quarter or a third’ of the record in 2016, said Deke Arndt, chief of the global monitoring branch at NOAA’s National Centers for Environmental Information, on a press call Wednesday.”
Research Scientist, SciSpace LLC, NASA Goddard Institute for Space Studies
I find this part confusing. The “percentage of the anomaly” caused by El Niño depends of course on the anomaly, which depends on the baseline. So it’s not really a useful number. El Niño caused a much larger fraction if you only look at a very recent baseline (e.g. just compare to 2014-15). A more straightforward number is the 2016 anomaly relative to what it would have been if ENSO were in a neutral phase. I calculated this to be ~0.13 C (0.23 F).
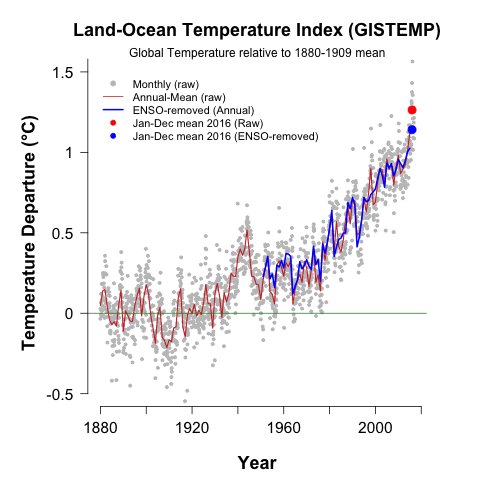
Scientist, University of Bonn, Germany
I agree with Chris Colose. If you mention a fraction (a quarter or a third) you need to mention relative to what. The total warming since 1900 is about 1°C. The influence of El Nino on the 2016 temperature was small compared to that.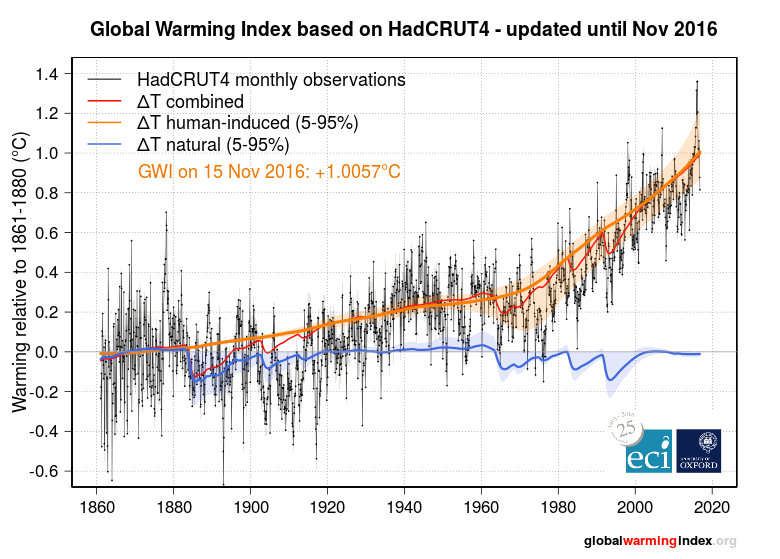
Source
“The particular signature of warming in 2016 was also revealing in another way, Overpeck said, noting that the stratosphere… saw record cold temperatures last year”
Director of Climate and Energy, The Breakthrough Institute
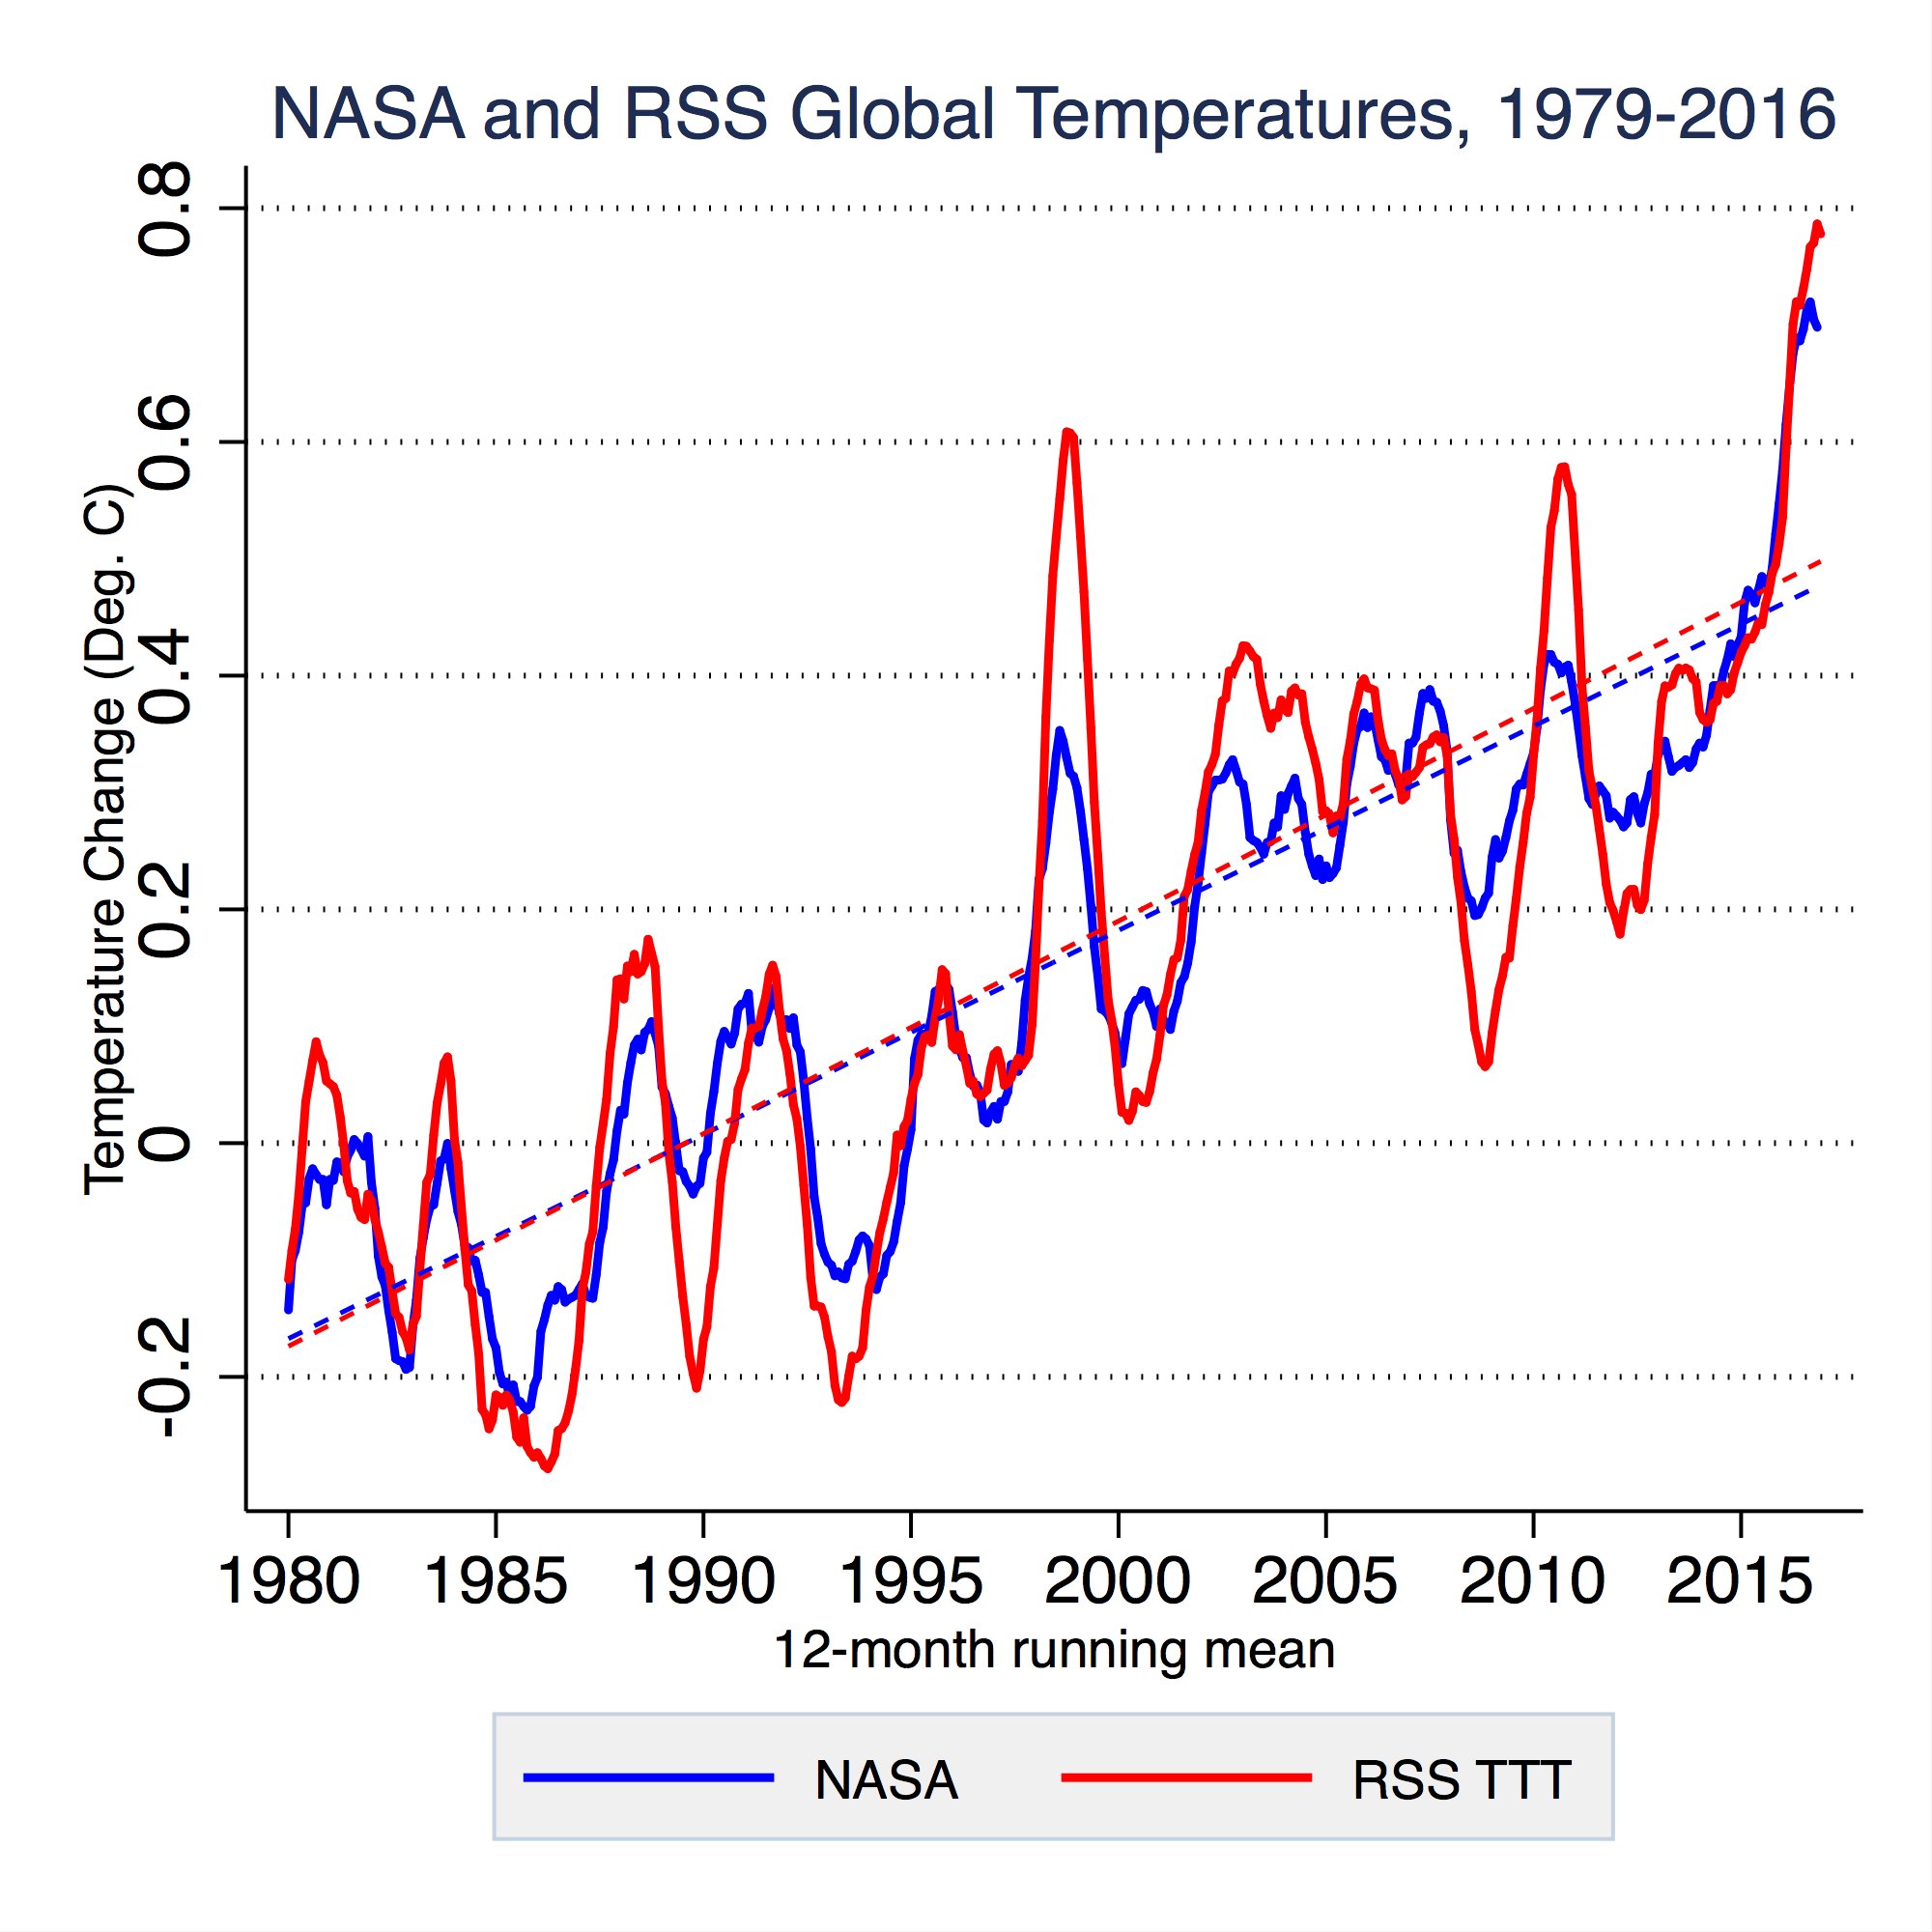
The troposphere (the lower part of the atmosphere) has also been rapidly warming. A newly updated record from Remote Sensing Systems using data from NASA satellites shows more warming in the troposphere than on the surface since 1979 (when satellite records began):
“[Gavin Schmidt:] ‘We don’t expect record years every year, but the ongoing long-term warming trend is clear.’”
Research fellow, University of Melbourne
This is a really important point, especially as 2017 is likely to not break the 2016 record. We expect year-to-year variability, so we may not break the 2016 record for a few years, but the overall trend is upwards.
Director of Climate and Energy, The Breakthrough Institute
Scientists like NASA’s Gavin Schmidt are also predicting slightly cooler 2017 temperatures as the El Niño fades, with 2017 projected to be somewhere between the 2nd and 5th warmest year on record. That said, we wouldn’t expect every single year to be a new record, and a slightly cooler 2017 is in no way inconsistent with the long term warming trend.
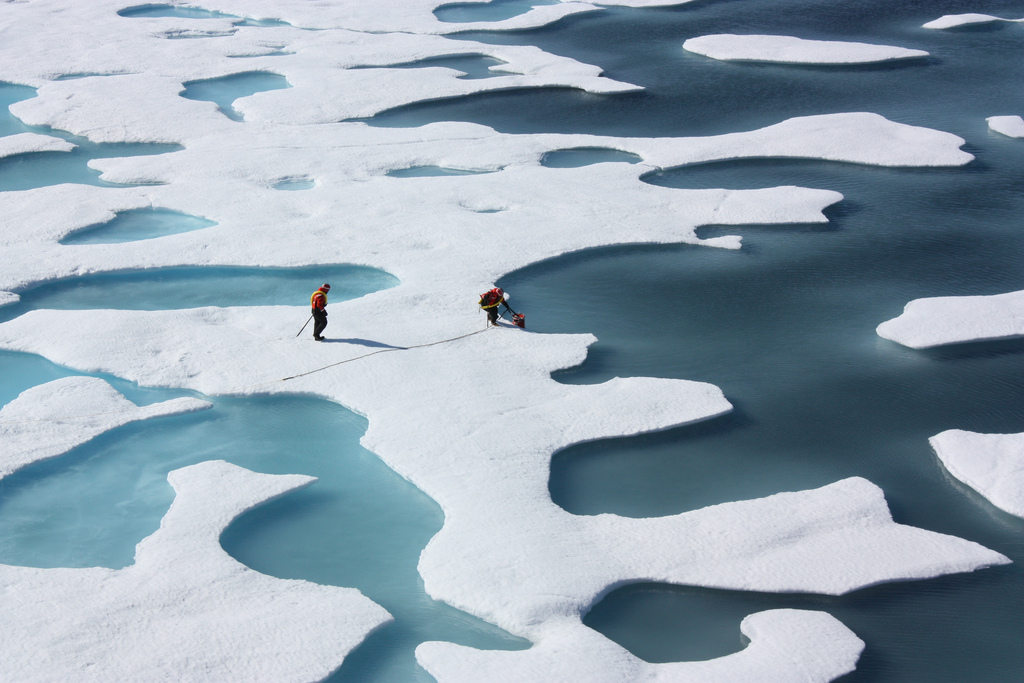
“Last year’s warmth was manifested across the planet, from the warm tropical ocean waters off the coast of northeastern Australia, where the Great Barrier Reef experienced its worst coral bleaching event on record and large scale coral death, to the Arctic, where sea ice hit regular monthly record lows and overall temperatures were also the warmest on record, at least from January through September 2016.”
Climate Scientist, University of California, Los Angeles
This section accurately describes major 2016 events that occurred in the Earth system, and which most likely would not have occurred without global warming.
Scientist, Coordinator of NOAA’s Coral Reef Watch, National Oceanic and Atmospheric Administration
The article overlooks the fact that not only was the bleaching on the northern Great Barrier Reef the worst on record, so was the bleaching in many areas around the world. In fact, the global coral bleaching event that is still underway is the longest, most widespread, and perhaps most damaging event on record.
“Extreme high temperatures were seen from India — where the city of Phalodi recorded temperatures of 51 degrees Celsius (123.8 Fahrenheit) in May, a new national record — to Iran, where a temperature of 53 degrees Celsius (127.4 F) was recorded in Delhoran on July 22.”
Research fellow, University of Melbourne
No direct link with climate change has been drawn by the article here and this is good. For these daily heat records, attribution to human-caused climate change is a lot harder than for extremes that occur on longer or larger scales. Indeed, in parts of India, the increase in aerosols due to pollution has counteracted the warming from greenhouse gas emissions so that there is virtually no trend in extreme high temperatures.