- Climate
Scientists explain what New York Magazine article on “The Uninhabitable Earth” gets wrong
Reviewed content
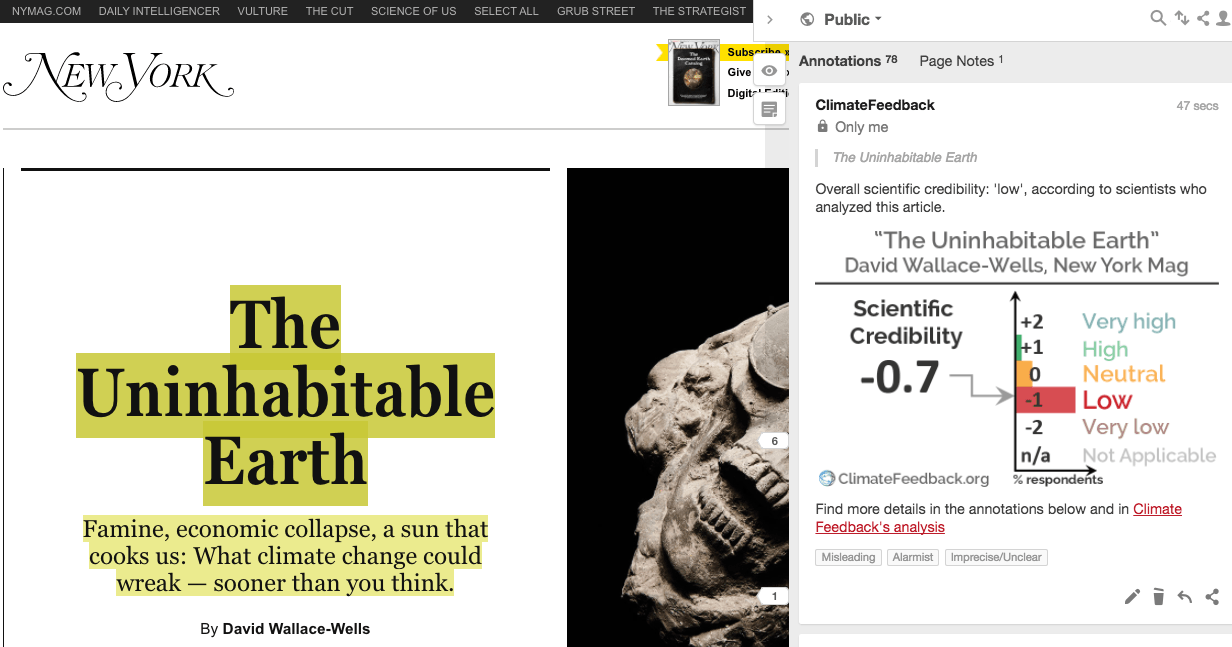
Headline: "The Uninhabitable Earth"
Published in New York Magazine, by David Wallace-Wells, on 2017-07-09.
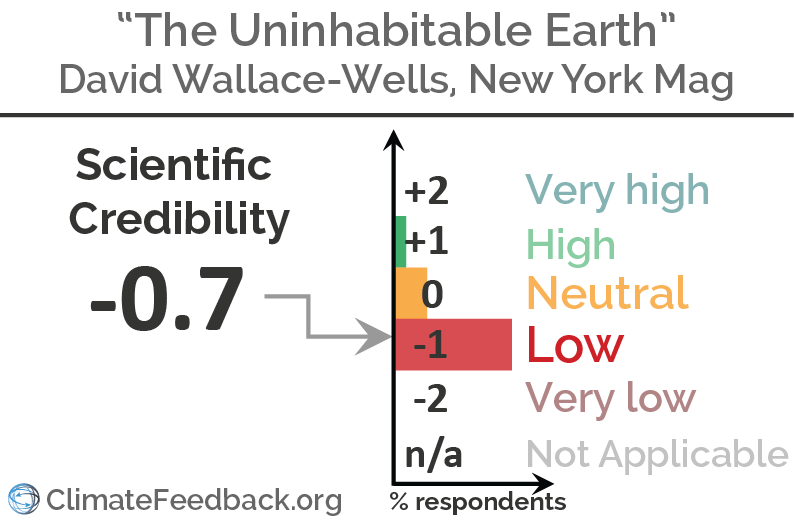
Scientists’ Feedback
SUMMARY
New York Magazine published an article by David Wallace-Wells detailing the potential impacts of climate change if no action is taken to reduce greenhouse gas emissions. Much of the article explores “worst case” scenarios of change in the climate system and the resulting impacts on human populations.
Scientists reviewed the article to determine whether the descriptions of those scenarios accurately reflect the state of scientific knowledge. The New York Magazine article has triggered a number of responses debating the merits of the decision to focus on worst case scenarios, but our review simply addresses the scientific accuracy of the article.
The reviewers found that some statements in this complex article do misrepresent research on the topic, and some others lack the necessary context to be clearly understood by the reader. Many other explanations in the article are correct, but readers are likely left with an overall conclusion that is exaggerated compared to our best scientific understanding.
See all the scientists’ annotations in context
This is part of a series of reviews of 2017’s most popular climate stories on social media.
UPDATE (15 July 2017): New York Magazine has published an annotated version of its article indicating sourcing, which also incorporates several edits based on scientists’ comments. Read more
Update (13 July 2017): The analysis has been updated to include several comments received just after the time of publication. The main conclusion of the analysis is unchanged.
GUEST COMMENTS

Professor of Meteorology, PennState University
The article paints an overly bleak picture by overstating some of the science. It exaggerates for example, the near-term threat of climate “feedbacks” involving the release of frozen methane (the science on this is much more nuanced and doesn’t support the notion of a game-changing, planet-melting methane bomb. It is unclear that much of this frozen methane can be readily mobilized by projected warming).
Also, I was struck by erroneous statements like this one referencing “satellite data showing the globe warming, since 1998, more than twice as fast as scientists had thought.”
That’s just not true. The study in question simply showed that one particular satellite temperature dataset that had tended to show *less* warming that the other datasets, has now been brought in line with the other temperature data after some problems with that dataset were dealt with.
Ironically, I am a co-author of a recent article in the journal Nature Geoscience (see e.g. this piece), using that very same new, corrected, satellite dataset, that shows that past climate model simulations slightly **over-predicted** the actual warming during the first decade of the 21st century, likely because of a mis-specification of natural factors like solar variations and volcanic eruptions. Once these are accounted for, the models and observations are pretty much in line—the warming of the globe is pretty much progressing AS models predicted… which is bad enough.
The evidence that climate change is a serious problem that we must contend with now, is overwhelming on its own. There is no need to overstate the evidence, particularly when it feeds a paralyzing narrative of doom and hopelessness.
REVIEWERS’ OVERALL FEEDBACK
These comments are the overall opinion of scientists on the article, they are substantiated by their knowledge in the field and by the content of the analysis in the annotations on the article.

Professor, Met Office Hadley Centre & University of Exeter
While it is clear that ongoing warming of the global climate would eventually have very severe consequences, the concept of the Earth becoming uninhabitable within anywhere near the timescales suggested in the article is pure hyperbole. The author has clearly done very extensive research and addresses a number of climate threats that are indeed major issues, but generally the narrative ramps up the threat to go beyond the level that is supported by science.

Climate Scientist, University of California, Los Angeles
This is an unusual piece in that it accurately describes some of the most dire consequences of unabated global warming but focuses almost exclusively on worst case scenarios. In doing so, it provides a compelling narrative of what could happen in the future, but does not accurately characterize the likelihood of particular outcomes relative to what is justifiable based upon existing scientific evidence.

Staff Scientist, Lawrence Berkeley National Lab
The article, while it does thoughtfully discuss some serious implications of climate change, also goes beyond the evidence in a number of instances of its exploration of worst-case scenarios.

Research Associate, Harvard University
This article focuses on the high-end scenario for global warming—high emissions and/or high climate sensitivity, high impacts. It selects recent research that highlights these outcomes. I am sympathetic to the author’s efforts to raise awareness about such scenarios, including impacts that are not always well discussed, and agree that we tend to focus too much on median outcomes. Nevertheless, I think the article would have gained from a more explicit acknowledgement that this particular focus is the goal of the article, as well as a from an explicit discussion (even if only qualitative) of the probabilities associated with these scenarios. Absent that, I am afraid the article, as such, feels misleading, or at least confusing for the general public.
In addition, the article contains a number of claims that are factually wrong, and a number of claims that are, to my knowledge, not substantiated by research.
I was also concerned by the implied claim that this article, being written after interviews with many climate scientists, somehow reflects scientists’ true opinion about global warming. I don’t believe it does.
What this article suggest to me is that we, as as community of scientists and science journalists, need to find a better way to more accurately discuss climate change projections and to convey the associated risks to the public.

Assistant Research Professor, University of Minnesota
In what seems an ode to new journalism, the author takes significant literary license to leverage information grounded in truth and paint an apocalyptic picture of extreme future scenarios possibly driven by anthropogenic climate change. Ambiguous references to studies, events and examples severely impairs credibility, as does a complete disregard for nuance.

Research Scientist, SciSpace LLC, NASA Goddard Institute for Space Studies
There are many arguments in this article at the interface of climate instability, socio-political disruption, and general global security. They are, however, clumsily wrapped together and doesn’t reflect well the actual risk posed by climate change.
A general comment concerning the climate response to future carbon emissions—one of the emergent insights from decades of research is that linearity is too powerful of a tool to be abandoned lightly. In this context, it is better to think of future warming as smoothly monotonic in our total carbon emissions rather than behaving erratically due to significant non-linearities in the system.
There is no evidence that a very abrupt methane source(s) will be readily mobilized into the atmosphere. Such scenarios are not supported by process studies, it is not emerging observationally, and is not borne out paleoclimatically (particularly in the mid-Holocene or Eemian interglacial, where high latitude summers were hotter than today). A small trickle of CH4 release is very plausible, but methane becomes converted to CO2 pretty quickly in Earth’s atmosphere, and there’s already some 200 times more CO2 in the air than CH4. These types of carbon cycle feedbacks will likely give the direct anthropogenic carbon input just a small boost in the near future.
Similarly, it’s not obvious that there are any significantly missing feedbacks that should radically alter the linear perspective (certainly, any under-representation of surface albedo feedbacks in current models are unlikely to be the difference maker, since the polar regions make up a very small percentage of the globe and the surface contribution to the planetary albedo is somewhat masked by clouds).
A Younger Dryas event today would likely be quite disruptive (the global mean temperature changes were quite modest, but the extratropical temperature re-organizations would still be significant); however, the processes leading to an event like this are pretty unique to a glacial climate undergoing melting, and is unlikely to occur in a warming world during our present interglacial.
Actual numbers are important here. The global temperature increase could indeed reach 4-5 degrees by 2100, if humans don’t do anything to our emissions, and beyond this patches of uninhabitable areas (for humans) could start to open up in the tropics, due to heat stress limits imposed by the evaporative limits of our body. Indeed, a world 5+ degrees warmer is a big cause for alarm, even if the world takes a linear path to that mark. The world also does not end in 2100, and while it is tempting to think of later dates as “very far off,” it is worth reminding ourselves that we would live on a different planet had people of the Viking era industrialized and emitted carbon uncontrollably.
Nonetheless, the near future climatic fate of New York probably looks more like the climate of South Carolina or Georgia than something from a Mad Max movie. This is still an important basis for concern given that the socio-political infrastructure that exists around the world is biased toward the modern climate.
Many of the nightmare scenarios in this article, such as no more food, unbreathable air, poisoned oceans, perpetual warfare, etc. are simply ridiculous, although food security is indeed an issue at stake (see David Battisti’s comments). A “business-as-usual” climate in 1-2 centuries still looks markedly different than the current one, but there’s no reason yet to think much of the world will become uninhabitable or look like a science fiction novel.

Scientist, University of Bonn, Germany
We are taking the climate system out of known territories. There will be many surprises and they are what worry me the most. Uncertainty is not our friend and that makes it very hard to say which worst case scenarios are unrealistic.
The bigger the stakes the smaller the acceptable risks. A risk someone may be willing to take personally will be larger than the risk one takes with a community, a country or civilization.
In that respect it is good that the article explores what surprises may be in store and talks about scenarios that are not likely, but a large part of the total risk.
However, unfortunately often statements are inaccurate, wrong or are missing important context. These inaccuracies tend to exaggerate the risks of climate change.
Staff Scientist, Lawrence Berkeley National Lab
The article, while it does thoughtfully discuss some serious implications of climate change, also goes beyond the evidence in a number of instances of its exploration of worst-case scenarios.

Professor, Earth Observatory of Singapore
Most statements in the article are based on peer-reviewed literature.

Professor, University of Exeter
The article is very alarmist, making very strong statements with very little (if any) support. Implying that climate scientists support the article, which I find hard to believe.
Such article does not help at all. It’s just too easy to prove it wrong and hence imply that the entire climate change issue is exaggerated.

Professor, University of Chicago
I do not disagree with the tone of the article in the way that most folks here seem to, and I think it does a service to highlight recent results and ideas throughout the scientific community. However there are inaccurate statements, like about satellite warming since 1998, unsupported conclusions or implications (about past mass extinctions, air chemistry, maybe arctic methane). But I feel that the overall thrust of the article is not wrong, wildly misleading, or out of bounds of the discussion we should be having about climate change.
Notes:
[1] See the rating guidelines used for article evaluations.
[2] Each evaluation is independent. Scientists’ comments are all published at the same time.
Key Take-aways
The statements quoted below are from the article; comments and replies are from the reviewers.
“The Uninhabitable Earth”
Climate Scientist, University of California, Los Angeles
The title itself is hyperbolic—there’s not really a plausible climate change scenario in which the Earth becomes truly uninhabitable. That’s not to downplay the very real and very large threat to human lives, economies, infrastructure, ecosystems, and species—and the author does a good job cataloging many of these later in the piece. But taken literally, the title implies a future bleaker than is warranted by existing scientific evidence.
“Famine, economic collapse, a sun that cooks us: What climate change could wreak — sooner than you think.”
Professor, University of Chicago
This is well-researched and on target. Unfortunately.
“Venus, which was once a very Earth-like planet with plenty of life-supporting water before runaway climate change rapidly transformed it into an arid and uninhabitable sphere enveloped in an unbreathable gas”
Professor, Met Office Hadley Centre & University of Exeter
There’s been a lot written about this recently, following the BBC’s publicising of Stephen Hawking’s remarks on it. I don’t think it is accurate to say that Venus was “once a very Earth-like planet” and hence imply that the runaway greenhouse effect could happen here. For one thing, Venus is much closer to the sun. A runaway greenhouse effect on Earth is not thought to be a plausible threat.

Research Scientist, Cold Regions Research and Engineering Lab
My expertise is not in exoplanetary climate, but it is not a definitively accepted “fact” that Venus was once habitable. There is still considerable debate regarding the past habitability of Venus (see links below). Therefore, this statement (which appears to imply that Venus’s climate trajectory is foreshadowing for Earth’s) comes off way too strong.
- Way et al (2016) Was Venus the first habitable world of our solar system?, Geophysical Research Letters
- Chassefière et al (2012) The evolution of Venus: Present state of knowledge and future exploration, Planetary and Space Science
“parts of the Earth will likely become close to uninhabitable”
Research Associate, Harvard University
I am not sure how one defines habitability. Paucity of resources (e.g., water, vegetation) does not necessarily make a region uninhabitable. So I think that strictly speaking, the author is referring here to studies showing that the combination of heat+humidity may exceed a threshold for human survival some part of the year in already-very-hot-an-humid parts of Southwest Asia (around the Gulf of Persia) by the end of the century1.
To my knowledge this kind of result hasn’t been shown for other regions, so in that context, the sentence “parts of”, while technically correct, may imply more than has been established.
Note, however, that even without exceeding survival limits, humid heat increases would have impacts on outdoor activities2.
- Pal and Eltahir (2016) Future temperature in southwest Asia projected to exceed a threshold for human adaptability, Nature Climate Change
- Dunne et al (2013) Reductions in labour capacity from heat stress under climate warming, Nature Climate Change
“there are alarming stories every day, like last month’s satellite data showing the globe warming, since 1998, more than twice as fast as scientists had thought”

Senior Research Scientist, Remote Sensing Systems (RSS)
This sentence is true for RSS data, but it’s somewhat misleading due to lack of context. If you look at the two most recent versions of the RSS data and compute linear trends Jan 1998-Dec 2016, you find that the new version has a trend value for this period of about 2.6 times larger than the previous version. But, it is good to remember that 1998 is a favorite starting point for those that seek to minimize the perceived threat of global warming. This preference is because 1998 is a relative maximum in global temperature (due to a large ENSO event), and thus trends that start in Jan 1998 are smaller than trends that start in other, nearby years. This means that when the change in trends between datasets is reported as a multiplicative effect, the change appears quite large. However, if one calculated the trends for Jan 1999-Dec 2016 instead, the trends increases by a factor of about 1.6, not 2.6, only a 60% increase. Of course this is still a pretty large increase.
The sentence also ignores the other sources of lower-tropospheric satellite data. The newer version of the UAH (Version 6.0) data shows less warming than the previous version. Also, the radiosonde datasets show more warming over this period that any of the satellite datasets (except maybe UAH V5.6), and have done so for years.
Research Associate, Harvard University
If anything, satellite measurements of lower atmospheric temperatures (which is what the author is talking about here, not near-surface, 2-meter temperature), show slightly less warming than predicted by models, a discrepancy that is a topic of ongoing research*.
- Santer et al (2017) Causes of differences in model and satellite tropospheric warming rates, Nature Geoscience
Scientist, University of Bonn, Germany
I would like to add that this “twice as fast” is just for a cherry-picked period. That is about as bad as mitigation sceptics claiming that global warming has stopped by cherry picking a specific period.
The real message was that satellite upper air warming estimates are unreliable (still are), but seem to confirm what we know from the surface warming.
This story was thus not alarming. If anything is was good news, it reduces uncertainties and as this uninhabitable-article already suggests: uncertainty is not our friend.
“Or the news from Antarctica this past May, when a crack in an ice shelf grew 11 miles in six days, then kept going; the break now has just three miles to go — by the time you read this, it may already have met the open water, where it will drop into the sea one of the biggest icebergs ever, a process known poetically as ‘calving.’”
Assistant Research Professor, University of Minnesota
Although a particularly dramatic and well-observed example of how floating ice shelves calve icebergs into the ocean, there is little evidence that the crack in the Larsen C ice shelf is directly related to climate change. At best this is subject to considerable debate, as it is difficult to directly connect particular atmospheric and oceanic mechanisms to the cracking of this single, albeit large, proto-iceberg.
For a very measured treatment of this topic, see the Guardian article by Professor Helen Fricker of Scripps Institute of Oceanography.
Having now just calved an iceberg as of July 12, it is good to hear from the most experience experts how concerning this event is. A really great simple summary is provided by David Vaughan, Director of Science for the British Antarctic Survey, who has worked on the Antarctic Peninsula and studied regional ice shelves for decades.
“But no matter how well-informed you are, you are surely not alarmed enough”
Climate Scientist, University of California, Los Angeles
It is quantitatively true—and often under-appreciated—that the likelihood of a “worse than expected” climate future is actually higher than a “better than expected” one. That is: the distribution of climate outcomes is not symmetrical, and as others have previously pointed out, “uncertainty is not our friend“.
“This article is the result of dozens of interviews and exchanges with climatologists and researchers in related fields”
Research Associate, Harvard University
This sentence implies, somehow, that the scientific content of this article comes from these scientists, or that they agree with it. I don’t believe that this is entirely the case—e.g. see Michael Mann’s comments—and, the author should have mentioned that as a caveat here.
“and we will need to have invented technologies to extract, annually, twice as much carbon from the atmosphere as the entire planet’s plants now do”
Staff Scientist, Lawrence Berkeley National Lab
Its unclear in this statement, about the relative amount of negative emissions needed versus the amount of carbon extracted by plants, whether the author means the total amount of photosynthesis by plants (which would be a false statement) or the total difference between photosynthesis, respiration, and disturbance (which would be a true statement). Plants photosynthesize about 120 petagrams of carbon per year, whereas the net land sink is more like 2-3 petagrams of carbon per year. It is the latter number that is comparable in magnitude to the negative emissions technologies required.
“at least four feet of sea-level rise and possibly ten by the end of the century”
Professor, Earth Observatory of Singapore
This statement is supported by peer-reviewed literature. 20th and 21st century rates of relative sea-level rise varied from -4 mm/yr to 3 mm/yr, and are dwarfed by potential future rates of 21st century rise, which under high forcing and unfavorable ice sheet dynamics could exceed 2 meters (i.e., a century-average rate of 20 mm/yr) in many locations.
“Most people talk as if Miami and Bangladesh still have a chance of surviving; most of the scientists I spoke with assume we’ll lose them within the century, even if we stop burning fossil fuel in the next decade.”
Professor, Met Office Hadley Centre & University of Exeter
These places are clearly at high risk of more frequent coastal flooding, but suggesting that we will “lose them within a century” is an exaggeration. Although there are substantial threats of flooding events, much of the country is not actually at risk of permanent indundation this century. Scientists and policymakers in Bangladesh are well aware of the threat of rising sea levels and are actively involved in research and planning on this, and this includes a strong focus on adaptation (as well as on making the case for reducing the threat through mitigation). They point to the example of the Netherlands to show that low-lying countries can adapt and even reclaim land from the sea. Of course this won’t be possible everywhere, especially in wilderness areas such as the Sundarbans which would be impacted by such measures themselves, but talk of the entire country “not surviving” is not a fair reflection of the scientific analysis.
“This past winter, a string of days 60 and 70 degrees warmer than normal baked the North Pole”
Scientist, University of Bonn, Germany
Regions with open water will stay relatively warm due to the relatively warm water. As soon as ice limits heat flows from the ocean to the atmosphere it can get very cold. Also, in general variability is much stronger in the Arctic—what sounds like a really big warm anomaly to an innocent reader in the USA is thus exceptional, but less so than the numbers suggest. That is context a reader would need to know.
- Steffensen et al (2008) High-Resolution Greenland Ice Core Data Show Abrupt Climate Change Happens in Few Years, Science
“Even if we meet the Paris goals of two degrees warming, cities like Karachi and Kolkata will become close to uninhabitable, annually encountering deadly heat waves like those that crippled them in 2015. At four degrees, the deadly European heat wave of 2003, which killed as many as 2,000 people a day, will be a normal summer. At six[…] summer labor of any kind would become impossible in the lower Mississippi Valley, and everybody in the country east of the Rockies would be under more heat stress than anyone, anywhere, in the world today[…].”
Research Associate, Harvard University
“At two degrees… at four… at six” What is missing here is a discussion of the probabilities of each target, depending on emission scenarios, etc… It’s fine to discuss high-end scenarios, but mentioning probabilities would add context—without deterring from discussing the extreme risks associated, I believe.
In general, the language in this paragraph is dire, but, in my opinion, this is an underappreciated consequence of global warming, and the author does well to highlight it.
It’s difficult to extrapolate future impacts from one-time events: the 2003 heatwave killed that many people in Europe because it was so far out from the usual distribution, and populations were poorly prepared. In a warmer future, preparedness and reactivity would arguably be improved, so impacts could be reduced.

Professor, University of Washington
The article highlights worst case projections of the intensity of heatwaves, but not of their frequency. Projections indicate return periods of high-mortality heatwaves will shorten over the century and, in some cases, the length of these high-mortality heatwaves will increase. That does not mean these events will occur every day during a summer. In many regions, this means a high-mortality heatwave could occur could approach becoming an annual event instead of rarely. Further, the projections do not take into account that increased heat-related hazards are only one factor that influences future risks. The other factors are the extent of exposure, the vulnerability of the exposed population, and the capacity of individuals and communities to prepare for and manage heatwaves. There is growing literature that sensitivity to heatwaves has declined over recent decades, presumably because of some degree of acclimatization to ever higher temperatures, increasing access to air conditioning and cooling centers, better understanding and communication of the risks of high ambient temperatures, and changing infrastructure to reduce urban heat islands. Recent projections using different approaches that take these changes into account show that taking these factors into account decreases the magnitude of risks.
“unprecedented droughts nearly everywhere food is today produced”
Professor, Met Office Hadley Centre & University of Exeter
Actually, overall the general projection is for the world to be wetter on average, with increasing drought in some regions but decreases in others, and increased annual rainfall in many places. The projections are extremely uncertain though, so while it is probably possible to cherry-pick model simulations that suggest increased drought in almost any region (and hence argue, probably fairly, that most places do have some increased risk of drought) these would not be expected to happen concurrently everywhere. A scenario with increased drought in one region would generally see a decrease elsewhere.
“a constant swarm of out-of-control typhoons and tornadoes and floods and droughts”
Research Associate, Harvard University
Not to nitpick—we don’t really know what a +6 °C world would look like in detail—but the connection between tornadoes and warming is unclear, at least in the observable record.
Climate Scientist, University of California, Los Angeles
While there is still some uncertainty regarding the response of tropical cyclones (i.e. typhoons and hurricanes) to global warming, there is now evidence that frequency in many ocean basins may actually decrease, but maximum intensity will likely increase.
There is indeed evidence that the frequency and intensity of floods/droughts is increasing over much of the globe*, and will continue to do so as the climate warms. This is not necessarily true universally–there will still be quite a bit of spatial and temporal diversity in the response of precipitation extremes to global warming, even in a six-degree-warmer world. But in general, it’s true that there will be dramatically more flood and drought events on a global basis with multiple degrees of warming.
- Diffenbaugh et al (2017) Quantifying the influence of global warming on unprecedented extreme climate events, PNAS
“The strongest hurricanes will come more often”
Climate Scientist, University of California, Los Angeles
This is a plausible claim, especially in a “six degree warmer world”.
“tornadoes will grow longer and wider”
Climate Scientist, University of California, Los Angeles
I’m not aware of any scientific evidence for this claim. There has been some work investigating global warming and atmospheric environments conducive to severe thunderstorms (and tornadoes), but to my knowledge there are no peer-reviewed studies that investigate changes in either “length” or “width” of tornadoes. In general, the net effect of climate change upon tornado activity/intensity remains uncertain1, with evidence for increasingly favorable atmospheric environments for tornado formation in some regions2.
- 1- Tippett et al (2016) More tornadoes in the most extreme U.S. tornado outbreaks, Science
- 2- Diffenbaugh et al (2013) Robust increases in severe thunderstorm environments in response to greenhouse forcing, PNAS
“hail rocks will quadruple in size”
Climate Scientist, University of California, Los Angeles
There is indeed evidence that maximum hail size in severe thunderstorms may increase with global warming (even while overall hail frequency may decrease).
- Brimelow et al (2017) The changing hail threat over North America in response to anthropogenic climate change, Nature Climate Change
- Diffenbaugh et al (2013) Robust increases in severe thunderstorm environments in response to greenhouse forcing, PNAS
“In other words, we have, trapped in Arctic permafrost, twice as much carbon as is currently wrecking the atmosphere of the planet, all of it scheduled to be released at a date that keeps getting moved up, partially in the form of a gas that multiplies its warming power 86 times over.”
Staff Scientist, Lawrence Berkeley National Lab
Most work on studying the dynamics of greenhouse gas balance in degrading permafrost systems, both as based on field measurements and as represented in ecosystem models for making climate feedback projections, seems to point to methane release being a relatively minor pathway for permafrost carbon to be released to the atmosphere, at least for terrestrial permafrost sources (which comprise most of the carbon mentioned here). It is true that terrestrial permafrost systems emit methane, but most of that methane is from recently photosynthesized carbon rather than older permafrost sources, and most of the carbon released from the older permafrost sources is released as either carbon dioxide or dissolved organic carbon rather than methane. So, while uncertainty on this issue remains high, and permafrost thaw is a potentially strong feedback process, this feedback seems likely to be dominated by carbon dioxide rather than methane.
A specifically misleading thing about these numbers, which are a metric called “global warming potential”, is that their units are based on the mass of the gas. Since the question here is whether a given atom of carbon will be emitted to the atmosphere contained within either a molecule of carbon dioxide or a molecule of methane, you have to take into account the fact that the molecule of carbon dioxide is much heavier, because of the two oxygen atoms it picks up in the transformation to that gas, versus the four hydrogen atoms it would acquire in becoming methane. What this means in practice is that you have to divide the global warming potential by the ratio of the weight of the molecules, which is 44/16 or 2.75. So strictly speaking, the 34 and 86 ought to read 12 and 31. This is a separate issue from the timescale one that others point out, and which further makes this comparison misleading.
Professor, University of Chicago
It would be wrong to say, as I often read in the popular press, that all or most of the frozen permafrost carbon will come out as methane, or that Arctic methane will have much impact on climate evolution in the near future. But this article doesn’t exactly say that. Carbon released from permafrost that eventually reaches the atmosphere as CO2 could significantly add to the “long tail” climate impacts from CO2. And this is a much more certain outcome than from methane.
The factor of 86 however is totally misleading about the impact of methane vs. CO2. This is an instantaneous impact on radiative forcing (a high-end one at that), and doesn’t reflect the longevity of CO2 (long enough to melt ice sheets) vs. methane (which, emitted now, will mostly be CO2 by the time of peak temperature, say, optimistically, 2050).
Vasilii Petrenko, Assistant Professor, University of Rochester:
This is incorrect.
First, to the best of my knowledge, there currently is not a strong consensus about whether thawing permafrost areas would be a net carbon sink or source. If the only process is that the permafrost carbon is respired by microbes and released to the atmosphere, then there is indeed a large carbon source. However, permafrost areas currently are mostly tundra or tundra-boreal forest biomes, which have relatively low biomass carbon stores. With warming, there would be more forest expansion into formerly permafrost areas, which may compensate for the respiration of permafrost carbon.
Second, with regard to large-scale methane release from thawing permafrost, currently available science indicates that this is unlikely. First, despite the ongoing Arctic warming, there is no evidence (from precise atmospheric measurements of methane) that Arctic methane emissions are increasing. Second, an ice core study that I led a number of years ago* indicated that “old” carbon sources (carbon sources depleted in the radioactive carbon–14 isotope) did not play a large role in a rapid methane increase that was associated with a period of warming 11,600 years ago. Permafrost carbon is old and relatively low in carbon–14 content. That warming provides a partial analog to what is happening today. While we can’t with 100% certainty rule out the possibility of large methane emissions from thawing permafrost in the future, the scientific data available to date indicate that the probability of such emissions is low.
- Petrenko et al (2009) 14CH4 Measurements in Greenland Ice: Investigating Last Glacial Termination CH4 Sources, Science
Assistant Research Professor, University of Minnesota
The author’s facts about methane are generally accurate, but he amps up concern about catastrophic release of methane from permafrost beyond what evidence supports. Scientists also investigate whether methane frozen at the seafloor of some continental shelves can be catastrophically be released to the atmosphere.
However, existing evidence suggests that natural processes prevent catastrophe. Marine methane (gas hydrates) are heavily processed in the water column, and no contribution to the atmosphere has yet been observed. See an excellent review by Carolyn Ruppel of the US Geological Survey and John Kessler of the University of Rochester*, which was also summarized in the popular press.
- Ruppel and Kessler (2017) The interaction of climate change and methane hydrates, Reviews of Geophysics
“The IPCC reports also don’t fully account for the albedo effect (less ice means less reflected and more absorbed sunlight, hence more warming); more cloud cover (which traps heat); or the dieback of forests and other flora (which extract carbon from the atmosphere). Each of these promises to accelerate warming”
Staff Scientist, Lawrence Berkeley National Lab
This statement is a mixture of true and false claims.
Physical feedbacks like albedo and cloud cover are most definitely included in Earth system models (ESMs) that are used to make future climate projections, so while the phrase “fully account for” isn’t well defined, the statement as written seems incorrect.
As of the 5th IPCC report, biogeochemical feedbacks from permafrost were not explicitly taken into account in fully-coupled ESM simulations. However, some simulations to quantify permafrost CO2 and CH4 feedbacks had been done as of that time and reported in the assessment text, and since then these types of studies have been expanded. The central estimate of the additional contribution of warming from these permafrost feedback processes is on the order of about 20 Pg C released per degree celsius global mean temperature change—or in physical terms about 0.1 watts per meter squared per degree Celsius—which is an important contribution to warming but likely less catastrophic than presented here. However, the uncertainty on these projections does remain high and I don’t think we can completely exclude the possibility of more serious permafrost-driven feedbacks yet.
Feedbacks arising from forest dieback is something that is included in some but not all ESMs used to make climate projections (i.e., those that have a “dynamic vegetation” component as opposed to a static, prescribed biogeography). Most carbon cycle models used in ESMs for climate assessments have extremely simplified treatment of forest mortality processes but, some do try to resolve this process, so while the uncertainty due to this process is extremely high and poorly captured in current ESM-based projections, it is not correct to say that it is not accounted for at all.
Also, the text implies that all feedback processes are positive, destabilizing feedbacks, which isn’t the case. There are also numerous negative, stabilizing feedbacks, that exist in the planet and that are also captured to various degrees in our models of the planet. As with the positive feedbacks, the uncertainty on these is large and most likely it is poorly captured by the current generation of ESMs.
Research Scientist, Cold Regions Research and Engineering Lab
“More cloud cover (which traps heat)” is a gross over-simplification regarding the role of clouds as a tuning knob for Earth’s climate. While it is true that clouds can act as a blanket and trap more heat, they also serve to reflect sunlight (see the prior sentence regarding the albedo effect).
Which cloud effect ultimately wins out has to do with the optical thickness of the cloud (how reflective it is) and (as a rough approximation), the cloud height. As a quick rule: Higher clouds will act better as a blanket since they are both colder (and therefore radiate less energy to space) and typically optically thin. Conversely, lower clouds act more as a reflector since they are warmer and optically thick.
The IPCC report does generally show a net positive cloud feedback, indicating global cloud feedbacks will lead to additional warming, but cloud feedbacks are extremely complicated and highly uncertain.
Research Associate, Harvard University
I am not sure what the author means here. The climate models whose projections the IPCC reports are based on definitely account for the changes in albedo from reduced sea-ice and snow cover as the world warms (although not necessarily changes in glaciers and ice caps extents—e.g. Greenland—which is maybe what the author means here), as well as the effect of changes in clouds (actually, the largest source of uncertainty in climate models projections); most models also now account for changes in vegetation and include an interactive carbon cycle (for instance, how a reduction in forest diminishes the land carbon sink).
“In fact, all but the one [extinction event] that killed the dinosaurs were caused by climate change produced by greenhouse gas. The most notorious was 252 million years ago; it began when carbon warmed the planet by five degrees, accelerated when that warming triggered the release of methane in the Arctic, and ended with 97 percent of all life on Earth dead.”
Professor, University of Chicago
Other agents of destruction have been invoked for the end Permian extinction, involving toxic fluorine fumes from volcanic emissions or sulfides from the deep sea.

Professor, PennState University
Climate change accompanies all of the mass extinctions, although severe warming isn’t necessarily always to blame. For example, the extinction at the end of the Ordovician occurred during a brief, enigmatic glaciation.
The “notorious” extinction 242 million years ago, at the end of the Permian, clearly (based on oxygen isotope proxy data) was accompanied by significant global warming likely triggered by the eruption of the “Siberian Traps” volcanoes, with concomitant buildup of carbon dioxide. Whether methane was released remains speculative, although not unlikely. The species extinction percentage in the ocean could have approached 97%, the proportion was likely lower on land.
“the geological record shows that temperature can shift as much as ten degrees or more in a single decade”
Research Associate, Harvard University
I am not sure, again, what the author is referring to here. Ice cores have shown that Greenland temperatures can swing by as much as 10 °C during glacial-interglacial transition*, yes, but we are not talking about global mean temperature here, more about swift reorganization of atmospheric circulation in interglacial glacial transitions that leads to strong regional change in the Arctic. I am unaware of studies showing past global-scale warming of 10 °C in a decade.
Note, however, that even global warming of a few degrees C in a century or two would be extremely fast, by geological standards.
“The last time the planet was even four degrees warmer, Peter Brannen points out in The Ends of the World, his new history of the planet’s major extinction events, the oceans were hundreds of feet higher.”
Research Associate, Harvard University
I don’t know what time period the author is referring to here, but closer to us, during the last interglacial (roughly 120,000 years ago), Earth was ~2 °C warmer than temperatures in the 19th century, and sea levels were about 5-6 meters higher. This suggests that even “good-case, 2 °C” long-term warming in our future could also raise oceans by that much eventually, even if the pace of that rise (and thus the amount of rise by 2100) is uncertain.
“Things almost certainly won’t get that hot this century, though models of unabated emissions do bring us that far eventually.”
Research Associate, Harvard University
This brings up an important point: while historically, IPCC-type projections stop in 2100 by convention, warming does not stop then, in particular for very high (perhaps implausibly high) greenhouse gas emission scenarios: warming goes on in the following centuries, up to ten of degrees in the worst case.
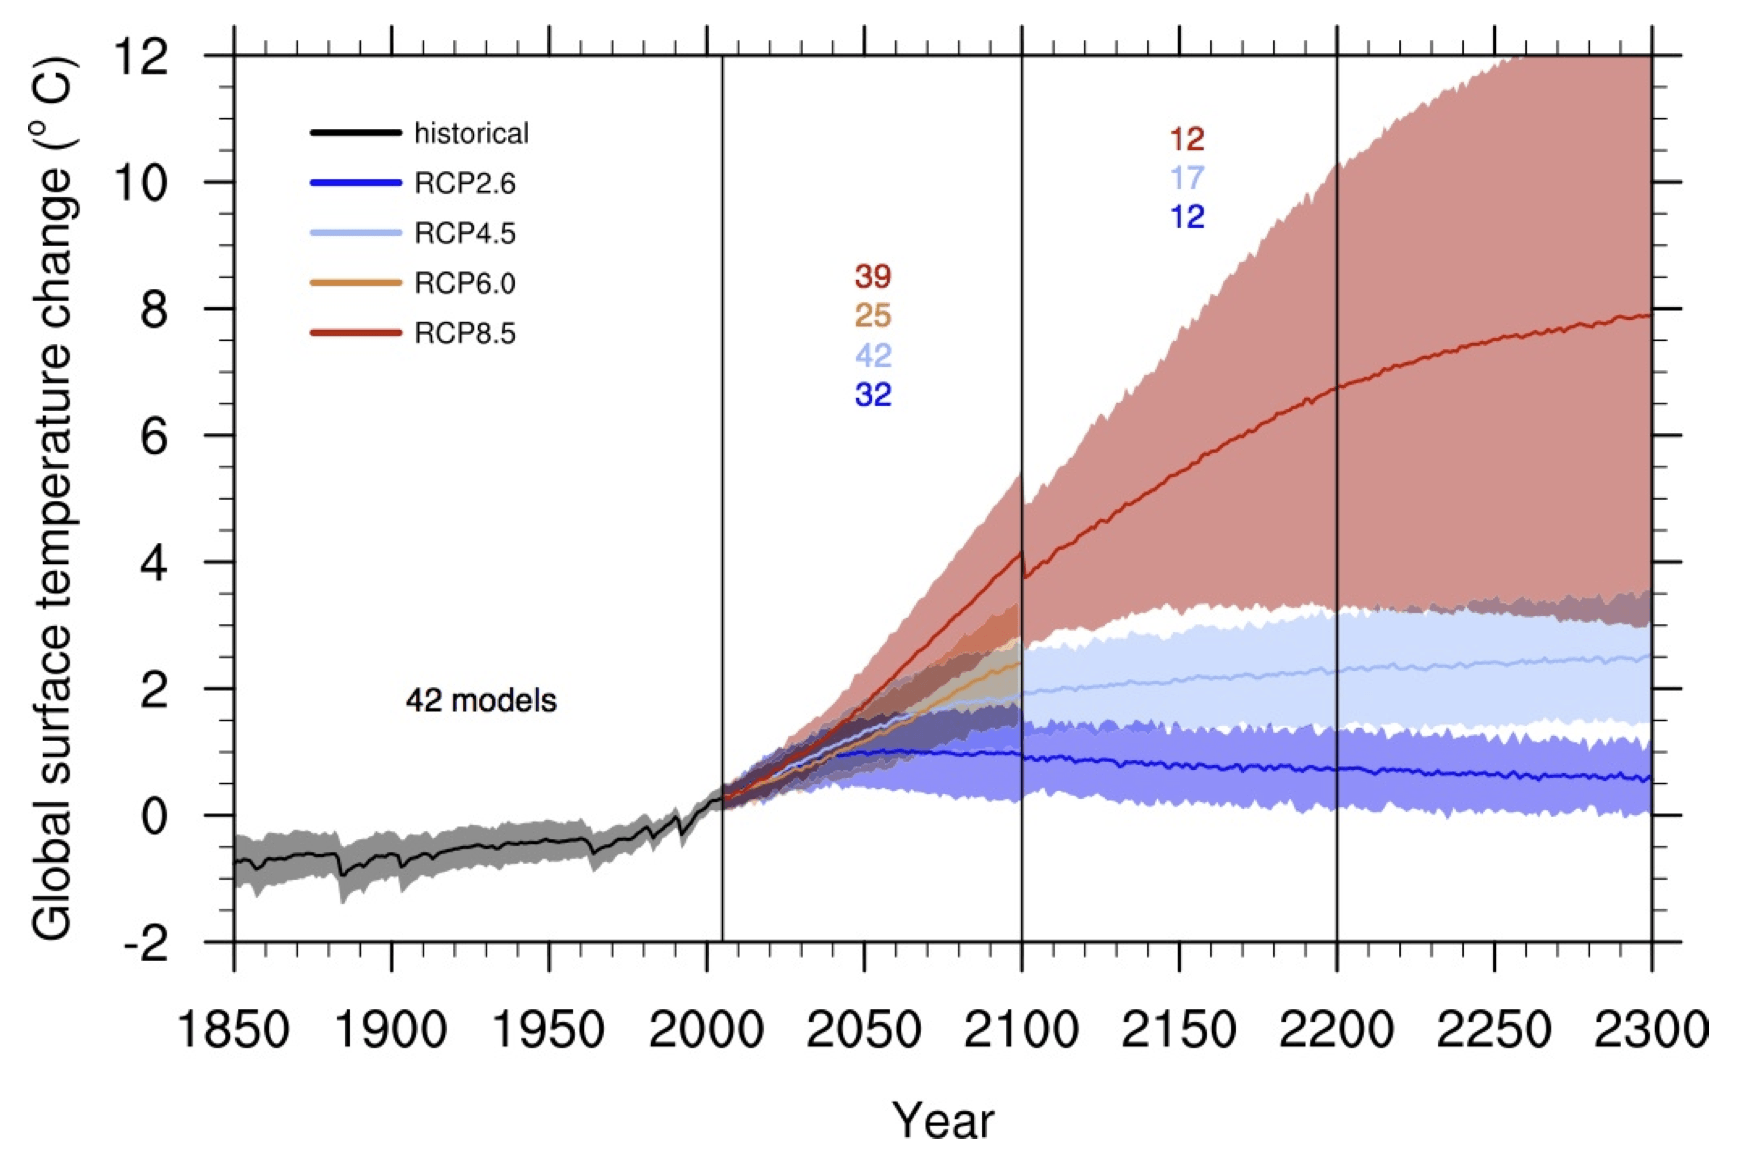
Source: IPCC
Note that the larger the warming, the larger the uncertainties between climate models (the shading).
“The end of food”
Professor, Met Office Hadley Centre & University of Exeter
This is hyperbole. Yes there are threats to crop production and other aspects of food security, but the scientific analyses do not suggest an actual “end of food”—it is more a case of regional winners and losers. Not all current food-producing regions are projected to lose their productivity. A redistribution of production would still still be a major issue that society will need to deal with, and may well require growing crops in new places, but this is not the same as suggesting that food supplies will completely come to an end.
“the basic rule for staple cereal crops grown at optimal temperature is that for every degree of warming, yields decline by 10 percent. Some estimates run as high as 15 or even 17 percent. Which means that if the planet is five degrees warmer at the end of the century, we may have as many as 50 percent more people to feed and 50 percent less grain to give them.”

Professor of Atmospheric Sciences, University of Washington
These numbers stem from the results of controlled field sites (in, for example, the Philippines, India and Mexico) and refer to the impact of local temperature changes on yield, all else being equal. (Also, note that the major grain producing regions are in the midlatitudes, where the projected temperature increases are substantially greater than the projected global average temperature increase.)
The projected changes in precipitation are sufficiently uncertain that it is not possible to quantitatively account for the impact of their changes, although the IPCC 2013 WG1 Report concludes: “In many mid-latitude and subtropical dry regions, mean precipitation will likely decrease, while in many mid-latitude wet regions, mean precipitation will likely increase under the RCP8.5 scenario.” (In IPCC lingo, “likely” is greater than 2/3 chance.)
Finally, there is also a fertilization effect associated with increasing CO2, although studies have shown that the deleterious impact of increasing temperature far outweigh the impact of increased CO2.
Research Associate, Harvard University
Well, for one thing, if food supplies decrease by 50%, one could argue that it is unlikely population would increase by 50% in the meantime… More to the point, the back-of-the-envelope calculation from the author, here, implies that all crops are grown at optimal temperature, which they are not.
Exact, global impacts of global warming on agriculture are difficult to quantify. One must also account for the effect of increased atmospheric CO2 on plant photosynthesis, as well as precipitation changes, which are uncertain in particular over land in the Tropics. Adaptation and management could also influence changes a lot. Generally, the estimate has been that warming would be neutral for mid-and high latitudes, up to a point, while being detrimental to agriculture in low latitudes. But again, global, quantitative impacts are uncertain, especially for large warming. I haven’t seen studies suggesting a global decrease by 50%.
“as the pathbreaking work by Rosamond Naylor and David Battisti has shown, the tropics are already too hot to efficiently grow grain, and those places where grain is produced today are already at optimal growing temperature — which means even a small warming will push them down the slope of declining productivity.”
Professor of Atmospheric Sciences, University of Washington
This statement is mostly accurate. To be more precise, it would read “Temperature in the tropics is already greater than the optimal temperature for growing the major crops (rice, wheat, maize). Most of the major grain-producing regions of the world are in the midlatitudes (e.g. the US, Europe, Ukraine, China), where today growing season temperatures are nearly optimal. Hence, warming due to increased CO2 will indeed decrease the yield of these crops in these high-producing regions.”
“with some of the world’s most arable land turning quickly to desert”
Research Associate, Harvard University
What regions? Is this a statement about the present, or the future?
If about the present, I am unaware of major arable land regions currently facing desertification.
Current drought trends—whether droughts, on the global scale, are increasing in extent and/or severity—and their future under global warming, is still somewhat uncertain and a topic of ongoing research.
“Precipitation is notoriously hard to model, yet predictions for later this century are basically unanimous: unprecedented droughts nearly everywhere food is today produced. By 2080, without dramatic reductions in emissions, southern Europe will be in permanent extreme drought, much worse than the American dust bowl ever was. The same will be true in Iraq and Syria and much of the rest of the Middle East; some of the most densely populated parts of Australia, Africa, and South America; and the breadbasket regions of China.”
Professor of Atmospheric Sciences, University of Washington
In general, there is large uncertainty in how precipitation will change due to increased greenhouse gases, including the Sahel in Africa, Australia, and many of important grain producing regions of the world (e.g., the US, Ukraine, China). Under high emission scenarios, models consistently project annual averaged drying in a few places by the end of the Century: e.g. southern Europe, northern Africa, and southern Africa. The IPCC 2013 WG1 Report concludes: “In many mid-latitude and subtropical dry regions, mean precipitation will likely decrease, while in many mid-latitude wet regions, mean precipitation will likely increase under the RCP8.5 scenario.” (In IPCC lingo, “likely” is greater than 2/3 chance.)
Research Associate, Harvard University
This is not true for precipitation. See the right panel on the plot below:
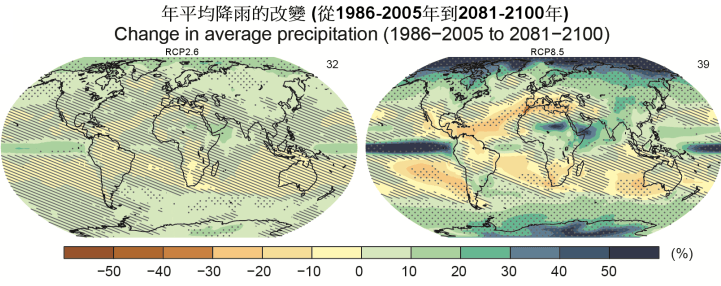
What the author is probably referring to is drought projections not based on precipitation alone, but rainfall+temperature, as shown for instance by the Palmer Drought Index.
However, there is a debate as to how best to interpret such projections in terms, for instance, of impacts on vegetation (and crop yields) or water resources*.
So I would argue things are more uncertain than the authors implies here.
- Milly and Dunne (2016) Potential evapotranspiration and continental drying, Nature Climate Change
Climate Scientist, University of California, Los Angeles
I agree with Alexis Berg’s comment above. Projections regarding widespread occurrence of historically unprecedented drought are in most cases the product of very strong warming that overwhelms any changes (positive or negative) in precipitation in terms of net moisture. Obviously, temperature-driven droughts will still have large and adverse consequences for agriculture in many regions—so the broader point made here regarding large risks to food production is reasonable.
“None of these places, which today supply much of the world’s food, will be reliable sources of any.”
Professor of Atmospheric Sciences, University of Washington
Even with no change in the natural variability in growing season temperature, increasing summer averaged temperature will likely lead to increased volatility in grain production in the midlatitudes because of the nonlinear relationship between temperature and yield. See section 7.4 of the IPCC 2013 WG2 Report for a recent summary.
Africa and “Iraq, Syria and much of the Middle East” are not on the list of the world’s major grain producer regions.
“In the sugarcane region of El Salvador, as much as one-fifth of the population has chronic kidney disease, including over a quarter of the men, the presumed result of dehydration from working the fields they were able to comfortably harvest as recently as two decades ago.”
Scientist, University of Bonn, Germany
If this author already writes “presumed result”, I would love to see a reference to the scientific literature. It would be quite surprising if the 1-1.5 °C warming we have seen up now makes such a differences.
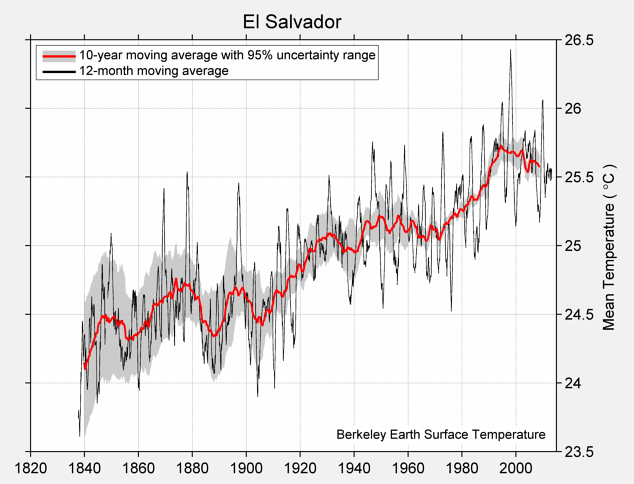
Source: Berkeley Earth
“The warmer the planet gets, the more ozone forms, and by mid-century, Americans will likely suffer a 70 percent increase in unhealthy ozone smog, the National Center for Atmospheric Research has projected.”
Professor, University of Chicago
Note that ozone concentrations are also determined by emissions of NOx and hydrocarbons, which can be controlled.
“[Carbon dioxide] just crossed 400 parts per million, and high-end estimates extrapolating from current trends suggest it will hit 1,000 ppm by 2100. At that concentration, compared to the air we breathe now, human cognitive ability declines by 21 percent.”
Research Associate, Harvard University
There is, indeed, some research showing impairments in cognitive function test scores in people exposed to CO2 concentrations in the 950-1,000 ppm range, and even significantly worse performance when CO2 gets to 1,500 and 2,500 ppm. But note that concentrations greater than ~1,000 ppm are, already today, often found in poorly ventilated rooms and buildings.
At even higher concentrations, documented metabolic and health effects start to appear—in fact, the safe limit for permanent, long-term exposure to higher concentration of CO2 does not appear to be well known. It seems like NASA and the Navy set that limit around 5,000 ppm for their crews in submarines and spacecrafts.
- Allen et al (2016) Associations of Cognitive Function Scores with Carbon Dioxide, Ventilation, and Volatile Organic Compound Exposures in Office Workers: A Controlled Exposure Study of Green and Conventional Office Environments, Environmental Health Perspectives
“That is especially bad because the Amazon alone provides 20 percent of our oxygen.”
Research Associate, Harvard University
This sentence somehow implies that deforesting the Amazon would reduce atmospheric oxygen by 20%. This is not true.
To quote Wally Broecker, who is cited later in the article: “Simply put, our atmosphere is endowed with such an enormous reserve of this gas that even if we were to burn all our fossil fuel reserves, all our trees, and all the organic matter stored in soils, we would use up only a few percent of the available O2. No matter how foolishly we treat our environmental heritage, we simply don’t have the capacity to put more than a small dent in our O2 supply. Furthermore, the Earth’s forests do not play a dominant role in maintaining O2 reserves, because they consume just as much of this gas as they produce. In the tropics, ants, termites, bacteria, and fungi eat nearly the entire photosynthetic O2 product. Only a tiny fraction of the organic matter they produce accumulates in swamps and soils or is carried down the rivers for burial on the sea floor.”
“The Arctic also stores terrifying bugs from more recent times. In Alaska, already, researchers have discovered remnants of the 1918 flu that infected as many as 500 million and killed as many as 100 million”
Professor, University of Washington
A series of cholera pandemics and 1918 Spanish influenza were global pandemics causing high mortality long before anthropogenic climate change began influencing the geographic range of climate-sensitive health outcomes. The World Health Organization and national health systems are preparing for changes in the intensity of transmission, geographic range, and seasonality of climate-sensitive infectious diseases. Certainly much more needs to be done, but the article implies national and International public health organizations and institutions will not take action when diseases emerge or re-emerge. This is not consistent with the responses to Ebola, Zika, and other recent events.
” You don’t worry much about dengue or malaria if you are living in Maine or France. But as the tropics creep northward and mosquitoes migrate with them, you will.”
Professor, University of Washington
The statement about the malaria incidence of malaria doesn’t mention the significant decline in the number of cases over the past several decades based on concerted public health efforts. Continuing and scaling up those programs would protect future populations from any changes in disease incidence associated with climate change.
“As it happens, Zika may also be a good model of the second worrying effect — disease mutation. One reason you hadn’t heard about Zika until recently is that it had been trapped in Uganda; another is that it did not, until recently, appear to cause birth defects.”
Professor, University of Washington
It would be helpful to know the source of the statements about Zika. Zika was first recognized in Uganda, but has not been trapped there. Zika has been moving around the world for the past few years, presumably associated with trade and travel. With limited surveillance of Zika and with limited numbers of cases, it isn’t possible to say whether the disease caused birth defects before the large outbreak last year; research is underway to determine that.
“That isn’t all that ocean acidification can do. Carbon absorption can initiate a feedback loop in which underoxygenated waters breed different kinds of microbes that turn the water still more “anoxic,” first in deep ocean “dead zones,” then gradually up toward the surface[…]This process, in which dead zones grow like cancers, choking off marine life and wiping out fisheries, is already quite advanced in parts of the Gulf of Mexico and just off Namibia, where hydrogen sulfide is bubbling out of the sea along a thousand-mile stretch of land known as the ‘Skeleton Coast.’”
Professor, PennState University
Ocean acidification per se doesn’t enhance anoxia: anoxia (loss of oxygen) results from warming (warm water holds less dissolved gas like oxygen), which would be the consequence of atmospheric CO2 buildup, as might more sluggish ocean mixing. It also is enhanced by increased nutrient delivery to the ocean from more rain and river flow on land under the warmer climate. More nutrients mean more algae growth in the uppermost ocean, more decaying organic matter below the surface, and thus less oxygen. Low oxygen zones would spread as the ocean became warmer and river flow increased as the event progressed. When oxygen is exhausted, bacteria do “breathe” other oxygen-containing compounds including sulfate and respire hydrogen sulfide. The coast of Namibia does experience these extreme conditions episodically, but such conditions are unlikely to spread globally until centuries to millennia of warming and eutrophication have occurred. Hydrogen sulfide likely contributed to the mass extinction, but the warming itself as well as other volcanic emanations like chlorine, fluorine, and sulfur dioxide were equally if not more important drivers of the extinction. The recovery from the extinction did take millions of years.
“they do know that in acid waters, oysters and mussels will struggle to grow their shells, and that when the pH of human blood drops as much as the oceans’ pH has over the past generation, it induces seizures, comas, and sudden death.”
Professor, University of Chicago
Human blood chemistry is regulated in a way the sea water is not, so this statement is only marginally relevant.
UPDATE (15 July 2017):
Here is the list of statements that have been modified from the original version of the New York Magazine article:
– added: “To read an annotated version of this article, complete with interviews with scientists and links to further reading, click here.”
– modified:
“there are alarming stories every day, like last month’s satellite data showing the globe warming, since 1998, more than twice as fast as scientists had thought.”
now reads:
“there are alarming stories in the news every day, like those, last month, that seemed to suggest satellite data showed the globe warming since 1998 more than twice as fast as scientists had thought (in fact, the underlying story was considerably less alarming than the headlines).”
– modified:
“the geological record shows that temperature can shift as much as ten degrees or more in a single decade.”
now reads:
“the history of the planet shows that temperature can shift as much as five degrees Celsius within thirteen years.”
– added: “This article has been updated to provide context for the recent news reports about revisions to a satellite data set, to more accurately reflect the rate of warming during the Paleocene–Eocene Thermal Maximum […]”