- Climate
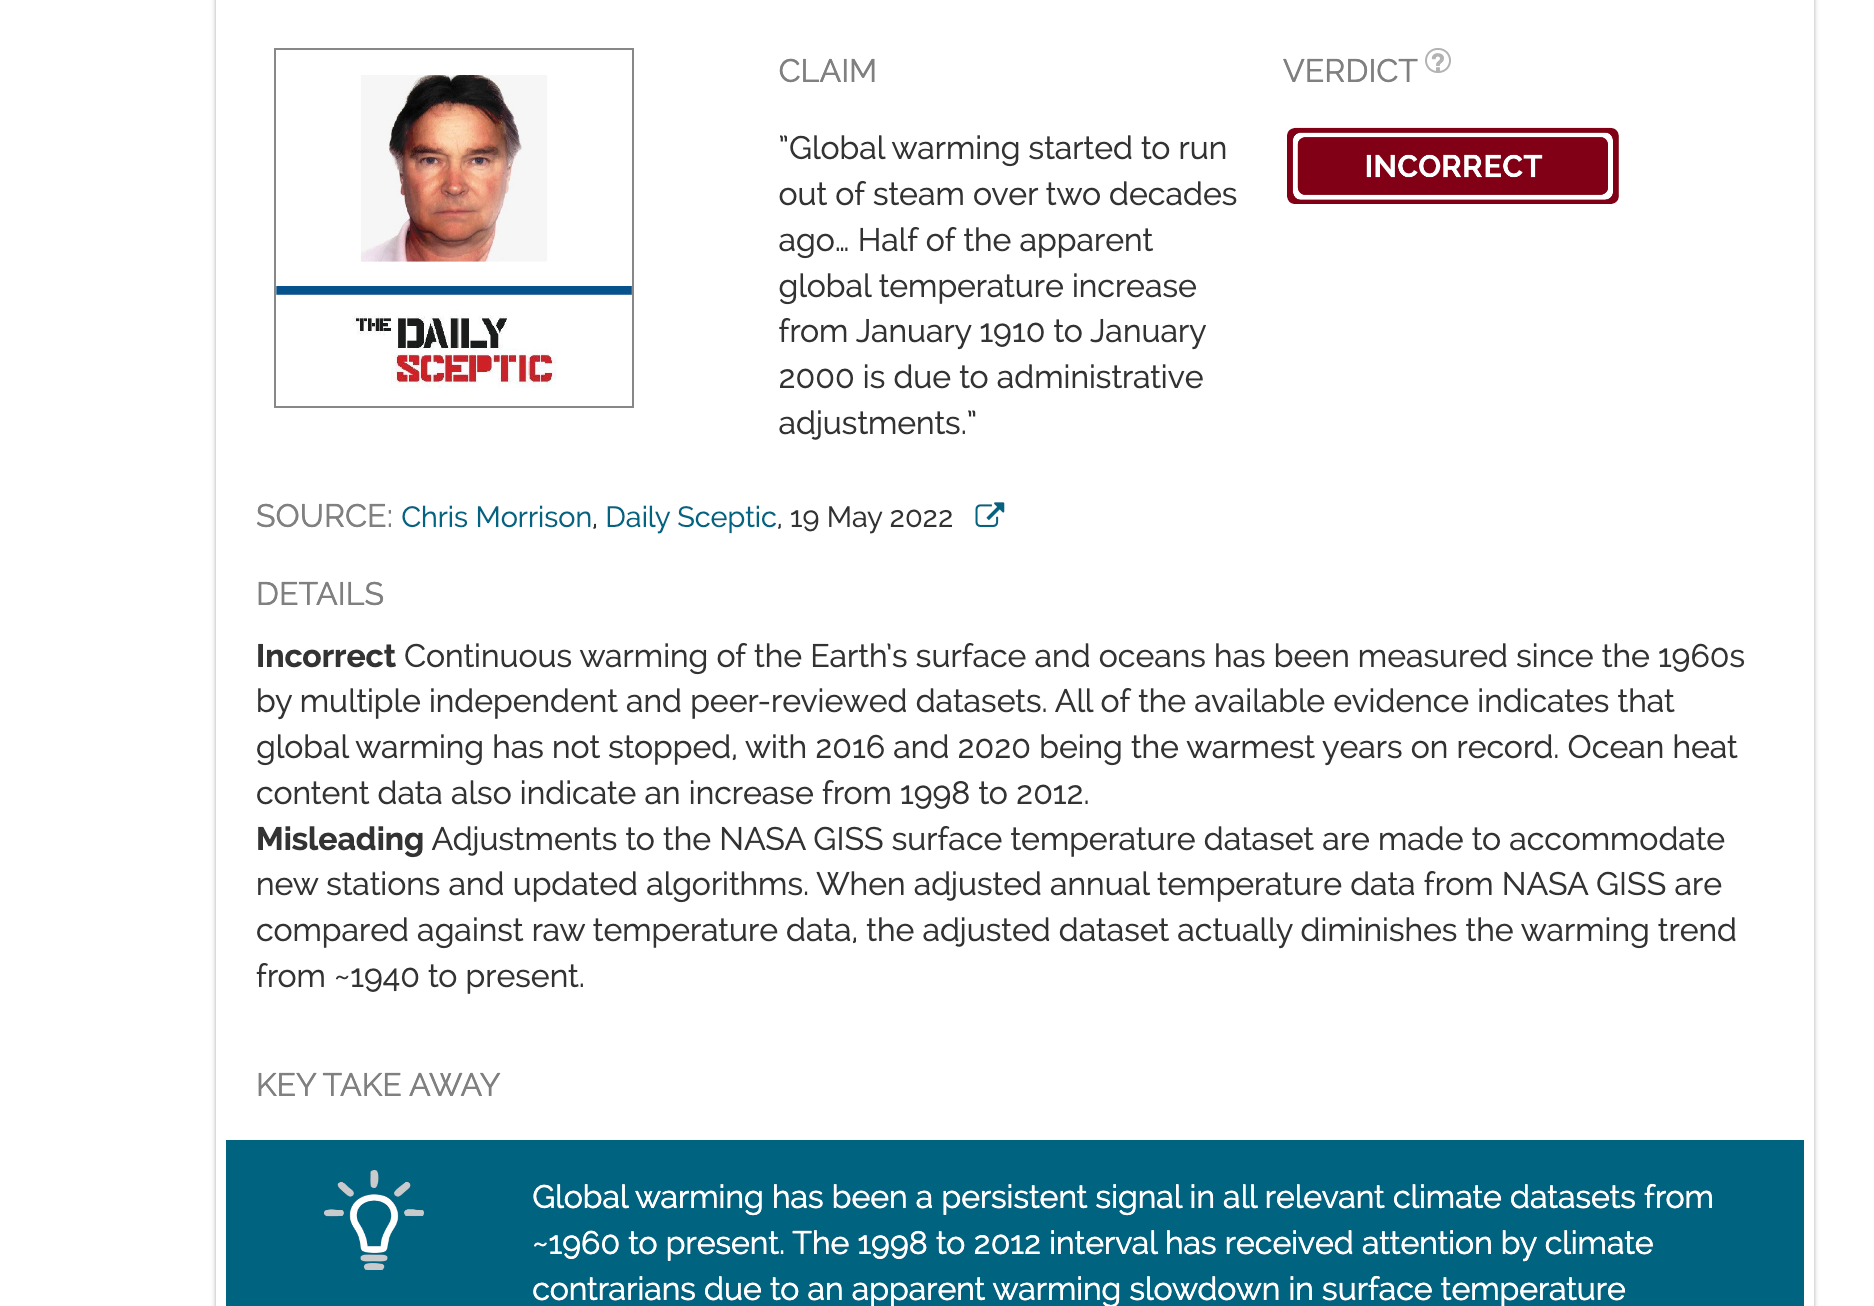
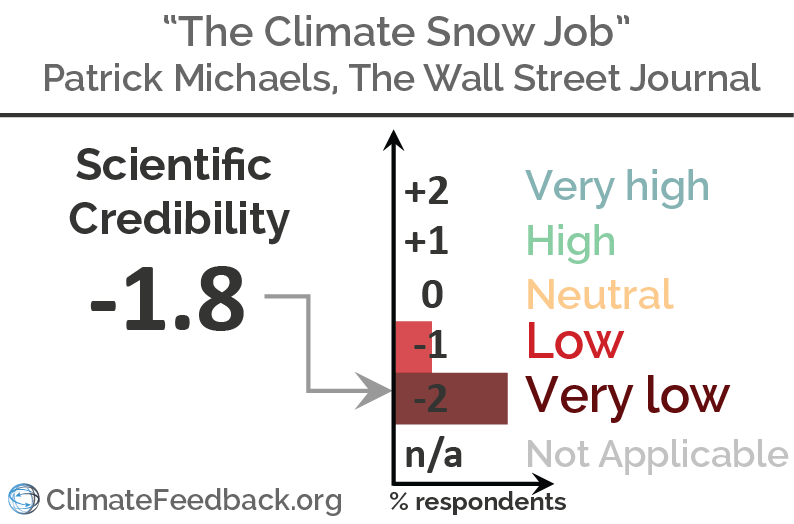
Analysis of "The Climate Snow Job"
Reviewed content
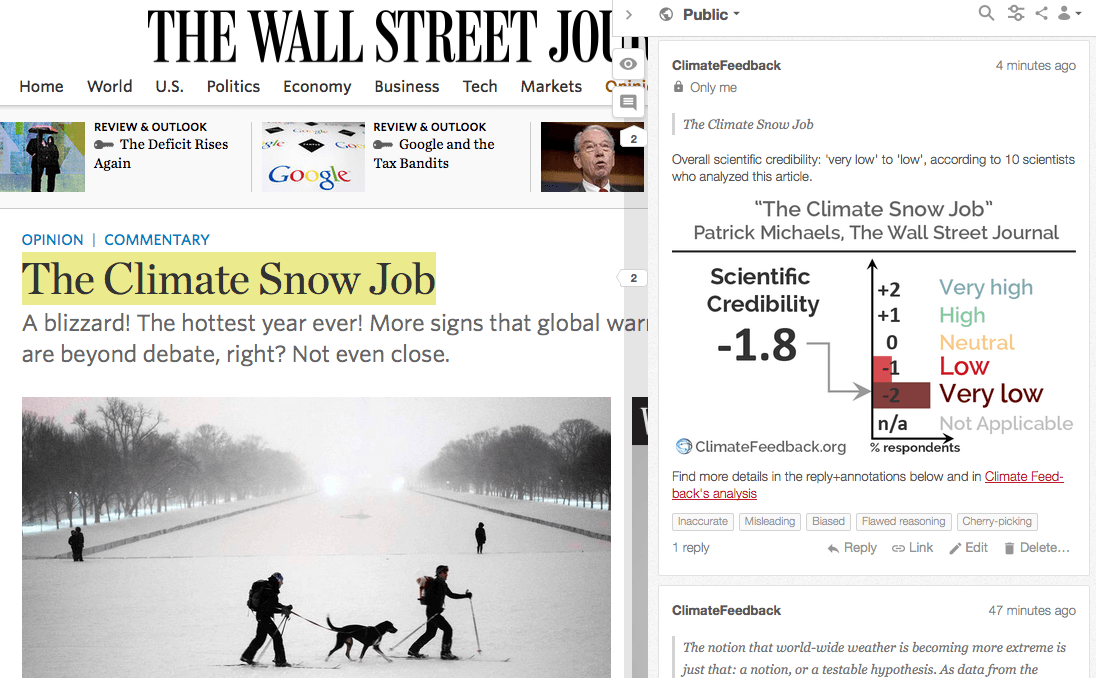
Published in The Wall Street Journal, by Patrick Michaels, on 2016-01-24.
Scientists’ Feedback
SUMMARY
The article misleads readers with a series of sweeping claims about distinct aspects of climate science and the implications of global warming for the global economy. Most of the article is devoted to casting doubt over the accuracy of the global temperature record. The author uses detailed technical descriptions to distract readers from the inaccuracies of the article, which involve cherry-picking data to support multiple unsubstantiated and discredited claims.
See all the scientists’ annotations in context
GUEST COMMENTS
This is a simple, deliberate, and misleading conflation of (natural) El Niño variability and (anthropogenic) global warming trend to suggest that 2015 warmth is soley related to El Niño variability. It is very easy to debunk Michael’s suggestion that 2015 warmth is due only to El Niño, as shown by the other reviewers. The weather-related reinsurance risk statement itself is plain false (just read the MunichRe corporate statements), as is the statement that “Without El Niño, temperatures in 2015 would have been typical of the post-1998 regime“.
REVIEWERS’ OVERALL FEEDBACK
These comments are the overall opinion of scientists on the article, they are substantiated by their knowledge in the field and by the content of the analysis in the annotations on the article.
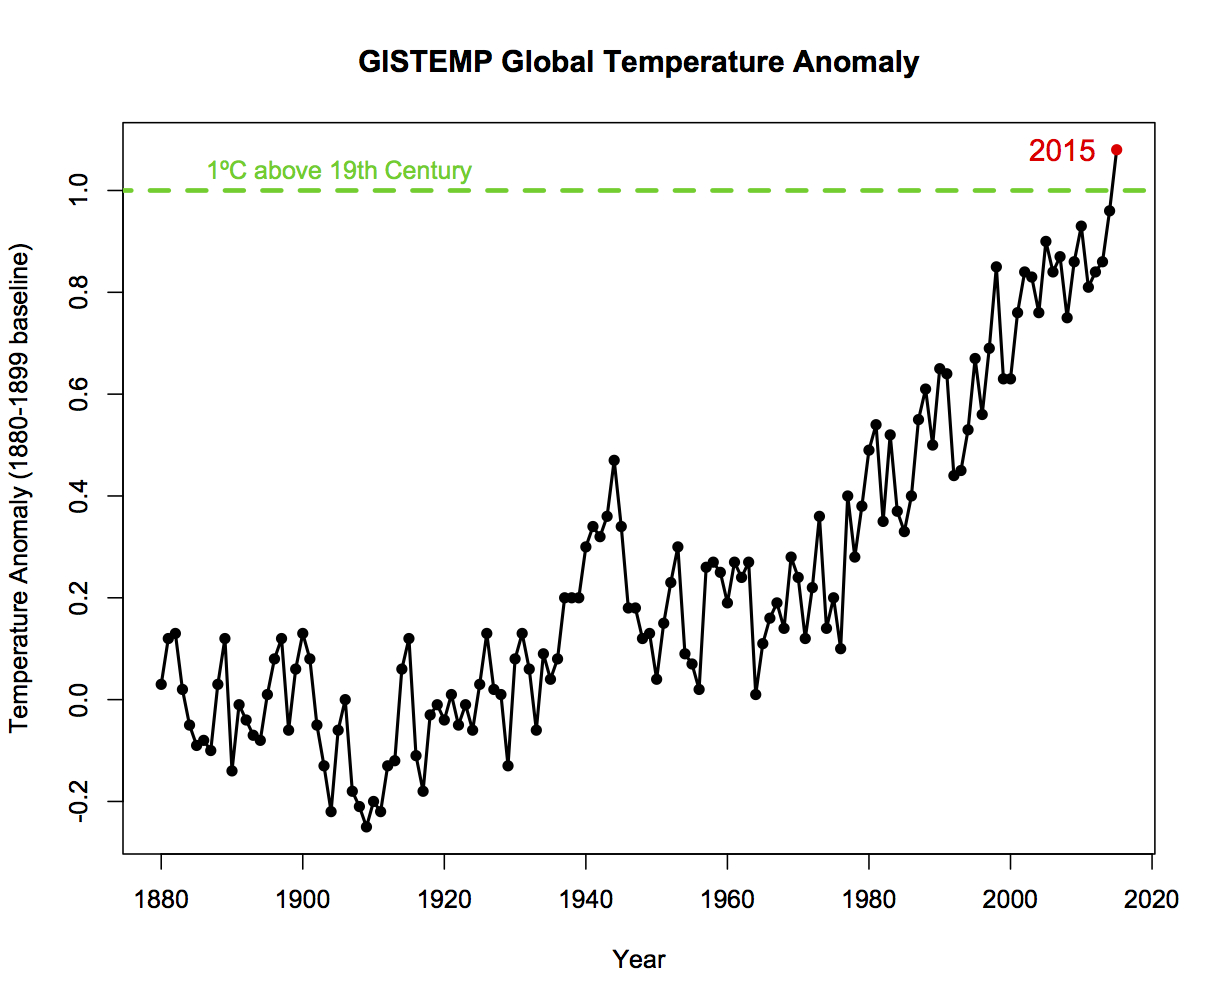
The author attributes the record 2015 temperature only to El Niño. El Niño contributed, but was assisted into the record books by a general warming trend that is directly linked to human CO2 emissions. Every data set has issues and is incomplete or incorrect in some sense, and can be used to question a result, but a proper analysis of multiple independent data shows what is really happening. The author did not do this, and instead cherry-picks data and misleads the reader.
Patrick Michaels (note he is referred to as a ‘climatologist’ even though he does not have a PhD in climate science) contorts and misrepresents facts, deliberately misleads with disinformation, and demonstrates either his lack of knowledge or willful ignorance of the science.
The author cherry-picks data to support multiple unsubstantiated and discredited claims. The detailed technical descriptions distract from the overall inaccurate picture presented by the article.

Founder & Executive Director, Science Feedback
The article argues about the effect of El Niño on global temperature but fails to include relevant information about the long term trend in global temperature observed by multiple lines of evidence.

Senior scientist, The Norwegian Meteorological institute
This letter is based on a series of misguided notions and does not rely on up-to-date knowledge.

Scientist, University of Bonn, Germany
At least this Wall Street Journal piece penned by Patrick J. Michaels was not derogatory.

Professor, Victoria University of Wellington
This article is indeed a snow job, as the title implies. The author has twisted the facts and distorted the science wildly. The author is well known for his wildly inaccurate climate “forecasts”, see e.g. Patrick Michaels: Cato’s Climate Expert Has History Of Getting It Wrong
Notes:
[1] See the rating guidelines used for article evaluations.
[2] Each evaluation is independent. Scientists’ comments are all published at the same time.
Featured Annotations
Below is a list of statements made by Patrick Michaels in his article along with comments and replies made by scientists.
“Surface temperatures are indeed increasing slightly: They’ve been going up, in fits and starts”
Scientist, University of Bonn, Germany
There are also other reasons why the global mean temperature changes from one year to the next, such as volcanoes and El Niño. You see these changes on top of the long-term trend due to increases in greenhouse gases.
“in fits and starts”
It is strange that Michaels emphasises this, because that is exactly the main reason why his idea that there was a “hiatus” in man-made global warming due to greenhouse gasses is so terribly wrong. Does anyone see a “hiatus” in the graph below? You no longer need statistics to tell you that this meme was wrong.
“Before carbon dioxide from economic activity could have warmed us up, temperatures rose three-quarters of a degree Fahrenheit between 1910 and World War II.”
Scientist, University of Bonn, Germany
Also before 1950 there was warming due to greenhouse gasses. Part of this warming was compensated by increases air pollution that also comes from burning fossil fuels. However, CO2 builds up, while air polution has a short life time. In the end, CO2 dominates. Before 1950 there was also warming due to natural causes due to less volcanoes and a stronger Sun.
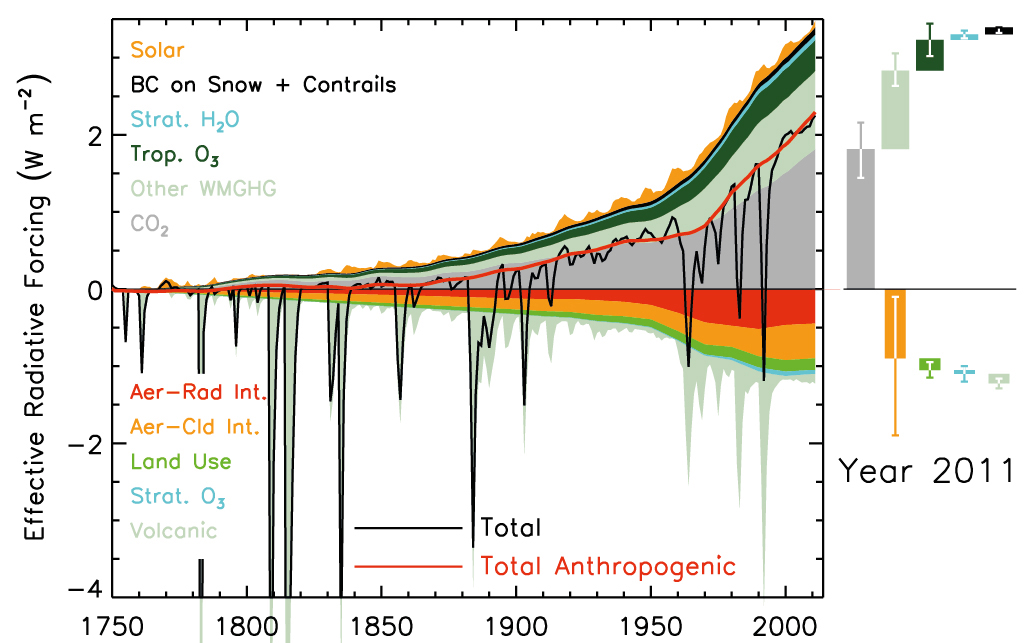
After 1950 we can say that our best estimate is that all warming was man-made, but also before 1950 part of the warming was man-made. All forcings (physical causes that change the temperature) are shown in this graph from the latest IPCC report.
Professor, Victoria University of Wellington
These changes are all a mix of solar radiation increase (before 1940), increased air pollution from industrialization mid-century, and greenhouse gas increase. Plus a few volcanoes and some natural variability. Models can capture all this really well, provided that they include the effects of greenhouse gas increase – otherwise, forget it. So sure, natural variations are in the mix, but human-induced greenhouse warming is becoming more important all the time.

Professor, McGill University
This statement is a mixture of exaggeration and cherry picking.
First for the cherry picking. Figure 1 shows that the period 1910-1944 had the largest 34 year warming since 1880. Figure 2 (see below) – the same data but plotted against the CO2 forcing, a surrogate for all anthropogenic effects – shows that by 1944 there was already about 0.3C (0.5F) of anthropogenic warming (i.e. 1944 was not “too early”). This is clarified in Fig. 3 that shows the residual: the estimate of the natural variability accounted for about 0.46C of the rise. This seems a lot for natural variablity – except that it was cherry picked to be the largest natural increase since 1880. Fig. 4 shows that it is almost exactly of the magnitude predicted by a 130-140 year return period.
In other words this event is exactly as expected by the theory of anthropogenic warming! Such events are predicted by the theory. See :
Lovejoy, S. 2014: Return periods of global climate fluctuations and the pause, Geophys. Res. Lett. 41, 4704-4710, doi: 10.1002/2014GL060478.
Fig. 2:

“Until last June, most scientists acknowledged that warming reached a peak in the late 1990s”
I’m not aware of any scientists that acknowledged this. This statement was always only true if you cherry-pick data and look at short time periods. 1998 was a record hot year, which is why many non-climate-scientists claimed “global warming stopped in 1998”, but that was incorrect. It was incorrect in 1999, and anytime between then and last June. See, for example, Climate myths: Global warming stopped in 1998
“a marginally significant warming trend in the data over the past several years, erasing the temperature plateau that vexed climate alarmists have found difficult to explain.”
As this figure shows, the corrections made to the NOAA dataset last year only changed their global temperature estimates very slightly compared to their previous dataset. (See Karl et al., 2015, Science, for details). Regarding the “erasing” of the “temperature plateau” (aka “hiatus”), as NASA’s Gavin Schmidt pointed out, “The fact that such small changes to the analysis make the difference between a hiatus or not merely underlines how fragile a concept it was in the first place.”
“When the Pacific circulation returns to its more customary mode, all that suppressed cold water will surge to the surface with a vengeance, and global temperatures will drop. Temperatures in 1999 were nearly three-tenths of a degree lower than in 1998, and a similar change should occur this time around, though it might not fit so neatly into a calendar year. Often the compensatory cooling, known as La Niña, is larger than the El Niño warming.”
Professor, Victoria University of Wellington
This avoids the point. If one fits a trend through just the El Niño years, or just the La Nina years, or just the neutral years, the result is the same – significant warming. ENSO adds year-to-year variations, but greenhouse gas increase provides the trend.
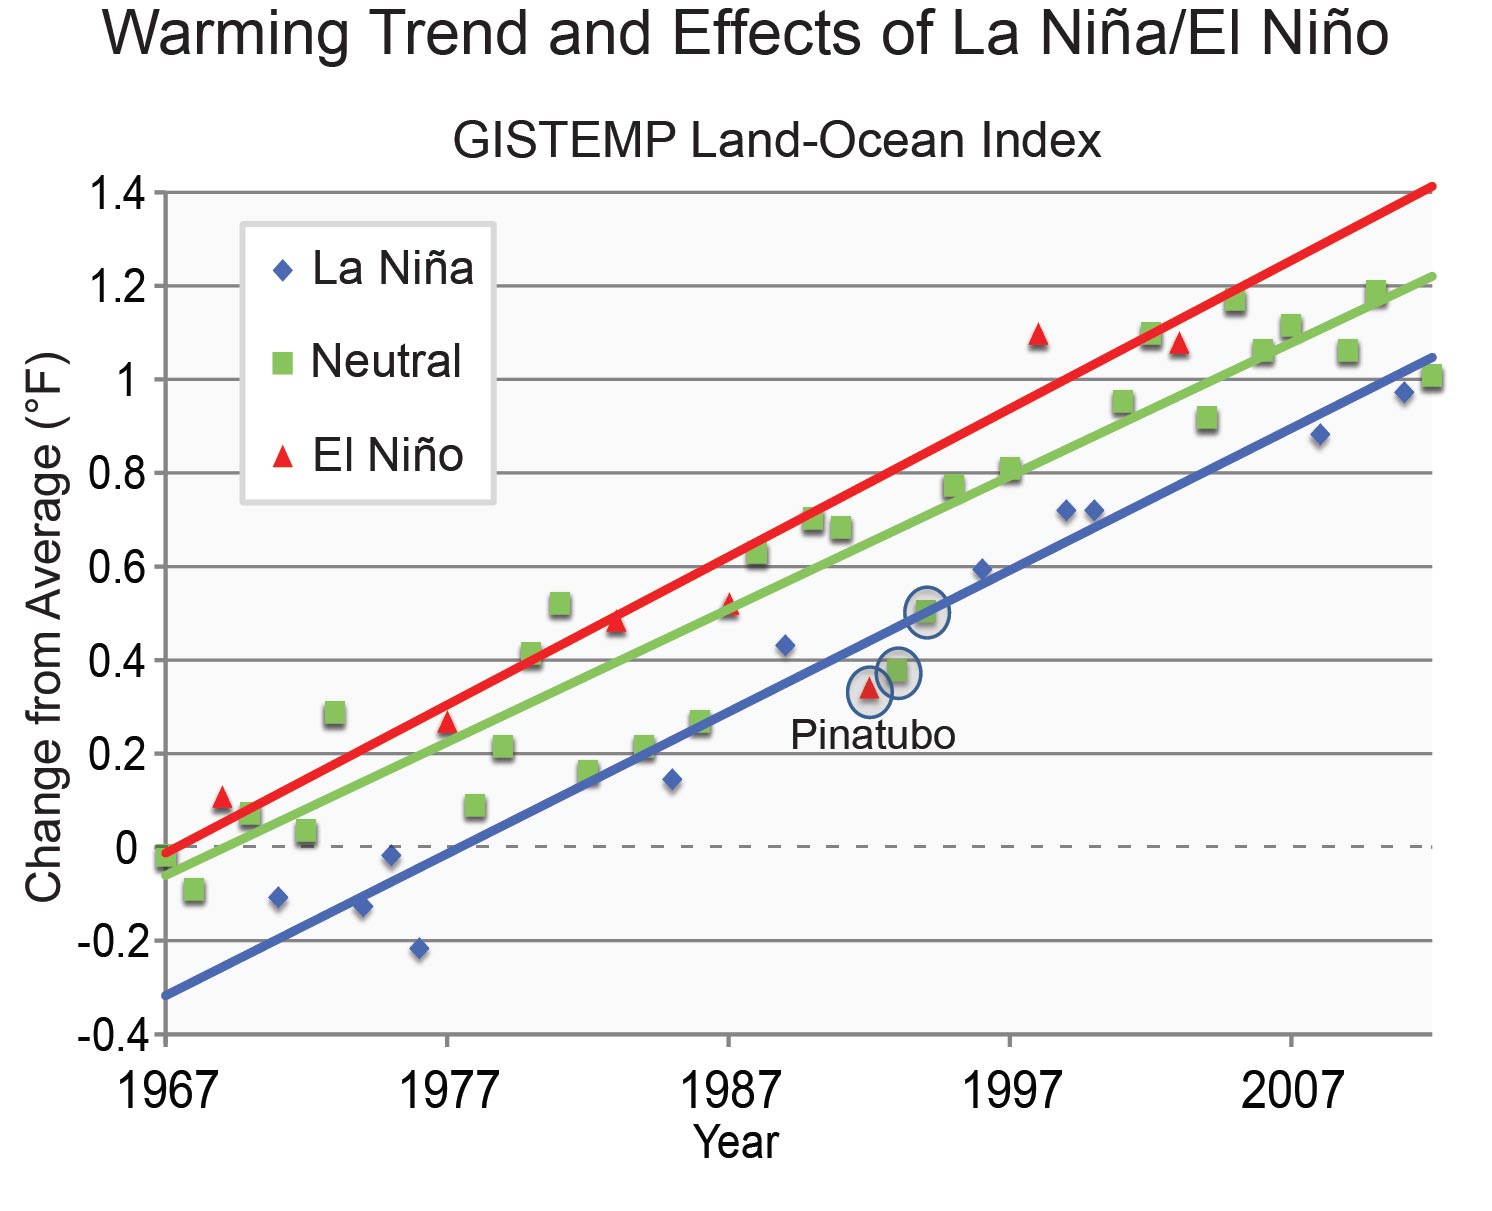
source: National Climate Assessment 2014
“the rate of warming in the satellite-sensed data is barely a third of what it was supposed to have been”
Scientist, University of Bonn, Germany
One wonders where this number, “a third”, comes from. The global mean temperature trend of the tropospheric temperatures (estimated by satellite) is very similar to that of the surface temperature over the short period for which we have satellite data.
It is expected that the tropospheric temperature would rise a bit faster than the surface temperature, but this is a small deviation. Far from the completely false claim of Michaels that the warming is only a third of what it should be.
As in any case, this deviation could be due to the models, the measurements, their data processing or the comparison. One would need to understand the reasons for this small deviation before one can claim that the models would need to be a little less sensitive.
“50% the modeled temperature forecasts for the rest of this century”
Senior scientist, The Norwegian Meteorological institute
This is pure hand waving without any substance to support it. The comparison between climate models and measurements suggest a good agreement

“The notion that world-wide weather is becoming more extreme is just that: a notion, or a testable hypothesis. As data from the world’s biggest reinsurer, Munich Re and University of Colorado environmental-studies professor Roger Pielke Jr. have shown, weather-related losses haven’t increased at all over the past quarter-century. In fact, the trend, while not statistically significant, is downward.”

Senior risk advisor, Deltares
This statement is not accurate, as 1) The main point is that up to now, we do not see an increase in loss records such as from Munich Re, due to anthropogenic climate change. That is not to say there is no increase in extreme weather, because there is. See IPCC SREX and AR5 reports, to which I also contributed. There is no signal in most loss records from floods and storms, though. So Patrick Michaels is misusing scientific information and consensus.
And 2) it misses a point: there is an upward trend in losses, only after correction for population growth and wealth increase, this trend disappears. See the paper Roger Pielke and Munich Re wrote together, with me: Confronting Disaster Losses
And also this recent review I did (freely accessible): Have Disaster Losses Increased Due to Anthropogenic Climate Change?
Professor, Victoria University of Wellington
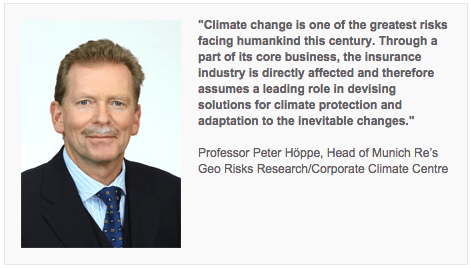
Right… that’ll be why the Munich-Re website states (quoting Professor Peter Höppe, Head of Munich Re’s Geo Risks Research/Corporate Climate Centre): “Climate change is one of the greatest risks facing humankind this century. Through a part of its core business, the insurance industry is directly affected and therefore assumes a leading role in devising solutions for climate protection and adaptation to the inevitable changes.”
“Last year showed the second-smallest weather-related loss of Global World Productivity, or GWP, in the entire record”
It is actually false, interesting that he brought this up. I consulted my reinsurance contacts and have several links that indicate the opposite view, that they are very concerned about mounting climate-related losses.
Renaissance Re 2015 SEC document: “We believe, and believe the consensus view of current scientific studies substantiates, that changes in climate conditions, primarily global temperatures and expected sea levels are likely to increase the severity, and possibly the frequency, of weather related natural disasters and catastrophes relative to the historical experience over the past 100 years. Coupled with currently projected demographic trends in catastrophe-exposed regions, we currently estimate that this expected increase in severe weather, such as tropical cyclone intensity, over coming periods will increase the average economic value of expected losses, increase the number of people exposed per year to natural disasters and in general exacerbate disaster risk, including risks to infrastructure, global supply chains and agricultural production.”
See also:
- “No climate-change deniers to be found in the reinsurance business“: “In Munich Re’s offices, there wasn’t much debate as the claims cheques flew out the door: The higher frequency of extreme weather events is influenced by climate change; and recent climate change is largely due to burning hydrocarbons. “I’m quite convinced that most climate change is caused by human activity,” says Peter Höppe, head of geo-risks research at Munich Re.“
- Severe weather in North America, Munich RE