- Climate
The Daily Wire makes wild claims about climate change based on no evidence
Reviewed content
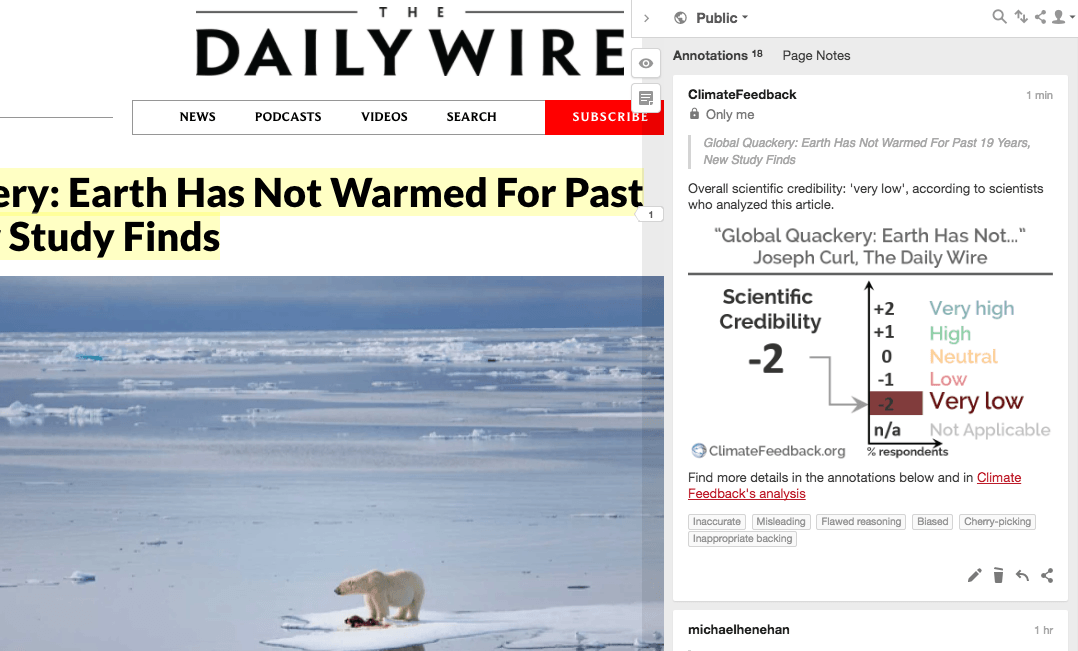
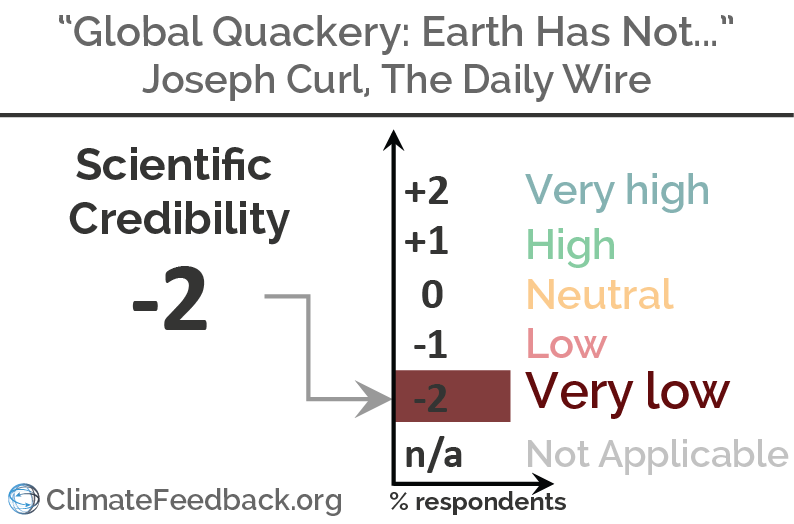
Headline: "Global Quackery: Earth Has Not Warmed For Past 19 Years, New Study Finds"
Published in The Daily Wire, by Joseph Curl, on 2017-05-08.
Scientists’ Feedback
SUMMARY
The title of this Daily Wire article inaccurately claims that global temperature has not warmed over the past 19 years—in direct contradiction with observations—and the article provides no evidence in support of this bold claim.
The article relies, for its first section, on a Telegraph article (analyzed separately here) that is flawed and itself based on claims from a blog post referring to data from the Danish Meteorological Institute (DMI). But DMI scientists explain that the article “fundamentally misrepresents both our research and the operational data products we provide”.
The second section quotes an article in the UK tabloid Daily Star. It claims that an imminent ice age is coming, based on a misrepresentation of the Sun’s influence on the climate that we have already covered in an earlier Climate Feedback review:
In that review, Prof. Michael Lockwood explained, “The whole argument rests on the incorrect myth that the Maunder minimum caused a ‘mini ice age’ and uses that name to draw specious implications and conclusions.” Georg Feulner also noted that “the scientists mentioned in the article have not predicted a ‘mini ice-age’, but an extended period of low solar activity similar to the 17th-century Maunder Minimum. The Maunder Minimum falls into a more extended period of somewhat cooler climate conditions termed the ‘Little Ice Age’ (although this was no true ‘ice age’). It has thus become rather fashionable to claim that the ‘Little Ice Age’ was caused by low solar activity, but this is not what the science says.”
See all the scientists’ annotations in context
This is part of a series of reviews of 2017’s most popular climate stories on social media.
UPDATE (16 May 2017): Following this analysis, the Daily Wire edited its article. Most notably, a statement describing the misleading claims from the Telegraph article as “findings of the DMI” has been removed. However, the misleading claims in the article generally stand uncorrected. Read more
REVIEWERS’ OVERALL FEEDBACK
These comments are the overall opinion of scientists on the article, they are substantiated by their knowledge in the field and by the content of the analysis in the annotations on the article.

Associate Professor, University of Utah
The article is full of misleading claims, factual inaccuracies, and lack of documentation for many of its claims.

Senior Scientist, Potsdam Institute for Climate Impact Research (PIK)
The article contains major inaccuracies and gives a highly biased viewpoint not supported by scientific evidence.

Climate Scientist, University of California, Los Angeles
While there are relatively few quantitative (and scientifically assessable) claims in this piece, those that are present are categorically false. This piece draws heavily upon a recent article in The Telegraph that itself is filled with fundamental factual errors and willful misinterpretation of data.
Postdoctoral Researcher, GFZ Helmholtz Centre Potsdam
The article contains little to no rational treatment of observational data, but relies on heavily biased secondhand interpretation. It has been written by someone who had no intention of researching the truthfulness of arguments that others have made, and merely reproduces their mistruths with added inflammatory language and chiding outrage. It rehashes logically-flawed and cherry-picked arguments from other articles and repeats them verbatim without questioning their authenticity. The article also rallies emotively against ‘Global Quackery’ from thousands of qualified climate scientists of all political persuasions, but then cites factually-inaccurate statements from the CEO of a dubious company as opinions of a ‘scientist’ and ‘expert’, without any question of their integrity.
Even the title is based on a lie. There is no ‘study’ that finds static temperatures for 19-years. This article is based on a newspaper article that makes this false statement based in turn on a blog post. This blog post in turn willfully misinterprets data that has been made publicly-available from the Danish Meteorological Institute. In no point along this production line of mistruths was anything like a peer reviewed study involved.
Notes:
[1] See the rating guidelines used for article evaluations.
[2] Each evaluation is independent. Scientists’ comments are all published at the same time.
Key Take-aways
The statements quoted below are from the article; comments and replies are from the reviewers.
“ever since December temperatures in the Arctic have consistently been lower than minus 20 C”
Climate Scientist, University of California, Los Angeles
It is indeed true that the Arctic is cold in winter—it’s hard to argue with that. But this statement belies the fact that winter 2017 was actually extraordinarily warm by historical standards, and second only to the record-shattering warmth observed just last year (in 2016). The attached plot, created by Zachary Labe and available at http://sites.uci.edu/zlabe/arctic-temperatures, shows that the -20 °C temperatures this winter are nearly 10 °C degrees above the long-term average of -30 °C! Therefore, the fact that temperatures were -20 °C this winter in the Arctic is actually a testament to just how much the Arctic has warmed in recent years.
This statement is both wrong and misleading.
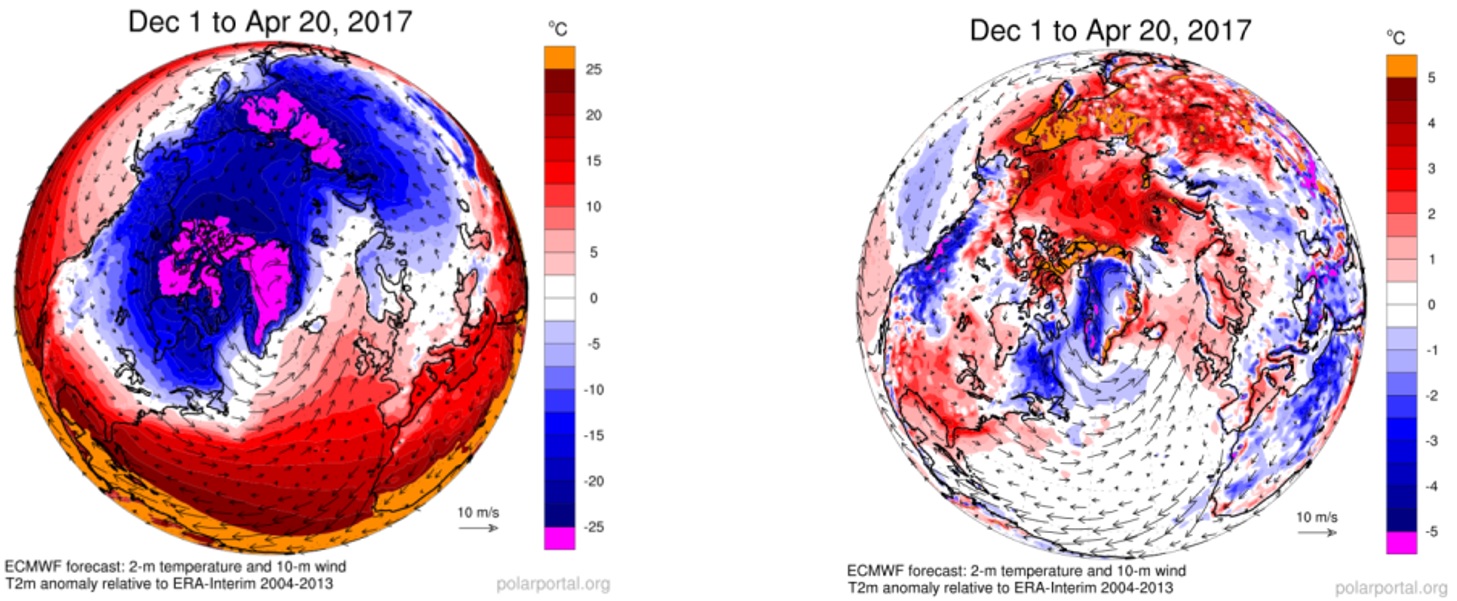
Firstly, most of the Arctic has in fact been consistently warmer than -20 °C this winter. For the period 1 December 2016 to 20 April 2017, the average temperature was above -20 °C everywhere in the central Arctic except north of Greenland and the Canadian Archipelago. Over the Greenland Ice Sheet and in Eastern Siberia (and only there), the temperature was below -25 °C.
Secondly, it should not be a surprise that the Arctic is very cold in winter (a period with little to no sunlight). It is much fairer to consider the difference between this winter and the average winter temperatures. Compared to our baseline of 2004-2013 everywhere in the Arctic region was at least 4 °C warmer than the average of 2004-2013 (in itself a warmer baseline period than the 1958-2002 baseline used elsewhere). Around Svalbard, it was about 4.5 °C warmer than average and in Northern Greenland, including Kap Morris Jesup, the world’s northernmost weather station (where a record +3 °C temperature was recorded on one day in February), Ellesmere Island in northeastern Canada, and large parts of eastern Siberia this winter were more than 5 °C warmer than the average as you can see below:
“record temperatures brought in 2016 by an exceptionally strong El Niño”

Research fellow, University of Melbourne
Last year the annual global temperature was about 1.1 °C above a late-19th century baseline but only about 0.1°C of this was due to the El Niño—the other 1 °C is due to human influences.
So while the record occurred in 2016 due to El Niño, most of the anomaly was due to climate change.
“the satellites now show that in recent months global temperatures have plummeted by more that [sic] 0.6 degrees”
Climate Scientist, University of California, Los Angeles
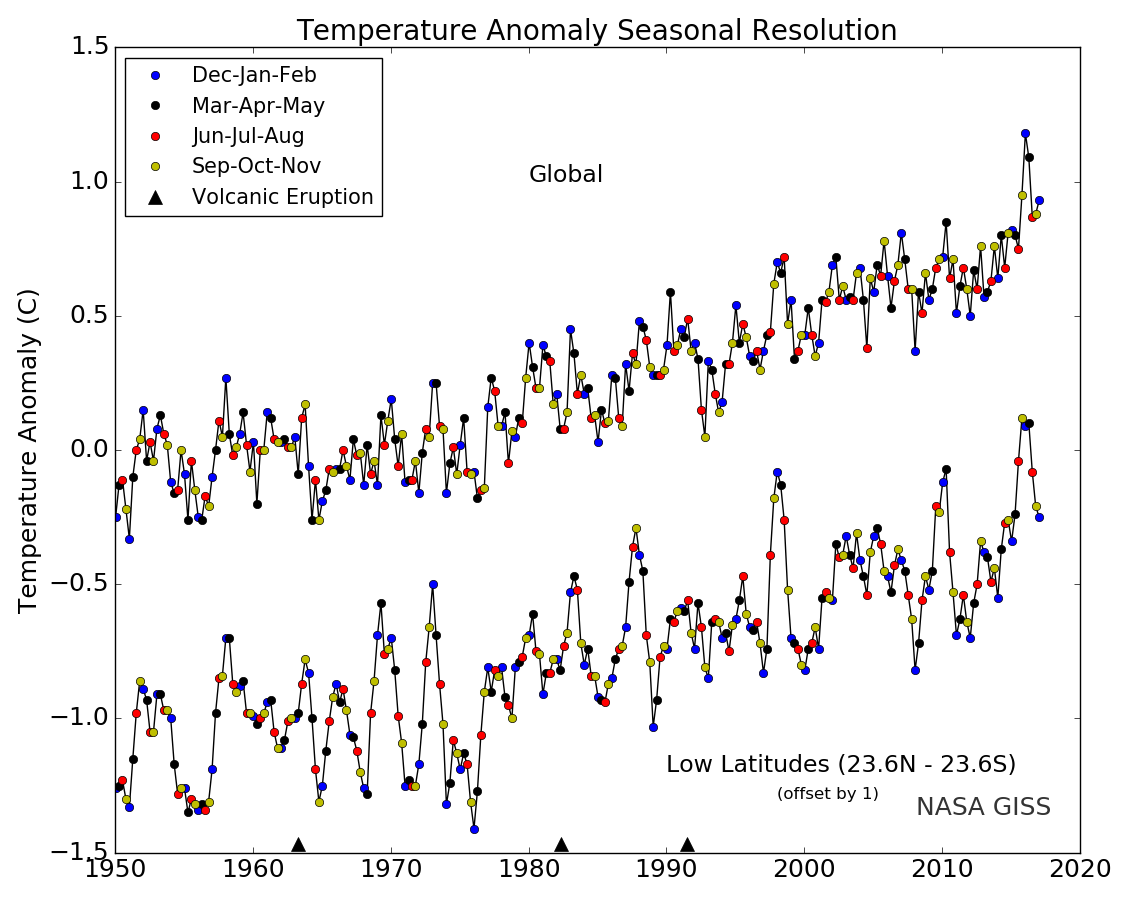
El Niño events do indeed elevate global temperatures temporarily, and this is partly why global temperatures in 2016 were so extreme. But as the attached plot from NASA GISS shows, temperatures so far in 2017 have still been extraordinarily warm in a historical context, and in fact would have been record-breaking if not for the large temperature spike that occurred in 2016. In any case, it is not scientifically meaningful to measure global temperature “trends” over a two year period; the large and statistically significant long-term warming signal overwhelms short-term variations on multi-decadal timescales.
Associate Professor, University of Utah
While true (and not necessarily in agreement with the more robust thermometer records for this period, this has no bearing on the long-term climate trend, which is driven by human emissions of greenhouse gases. It is misleading and a logical fallacy to claim this says anything about climate change, which is the long-term change in temperatures.

Director of Climate and Energy, The Breakthrough Institute
While temperatures have declined modestly from the peak of the El Niño event, this is expected behavior, particularly in satellite records where El Niño is amplified. However, temperatures in January through April are quite above average to-date, and while we may not set a record temperature in 2017 compared to 2016, it will very likely be the second warmest year on record (at least on the surface).
Through present there is no sign of any sort of pause or slowdown in any of the surface records or one of the two satellite records (the RSS groups latest version 4 record). The only record showing a continued pause is the one produced by the University of Alabama, Huntsville (the UAH record).
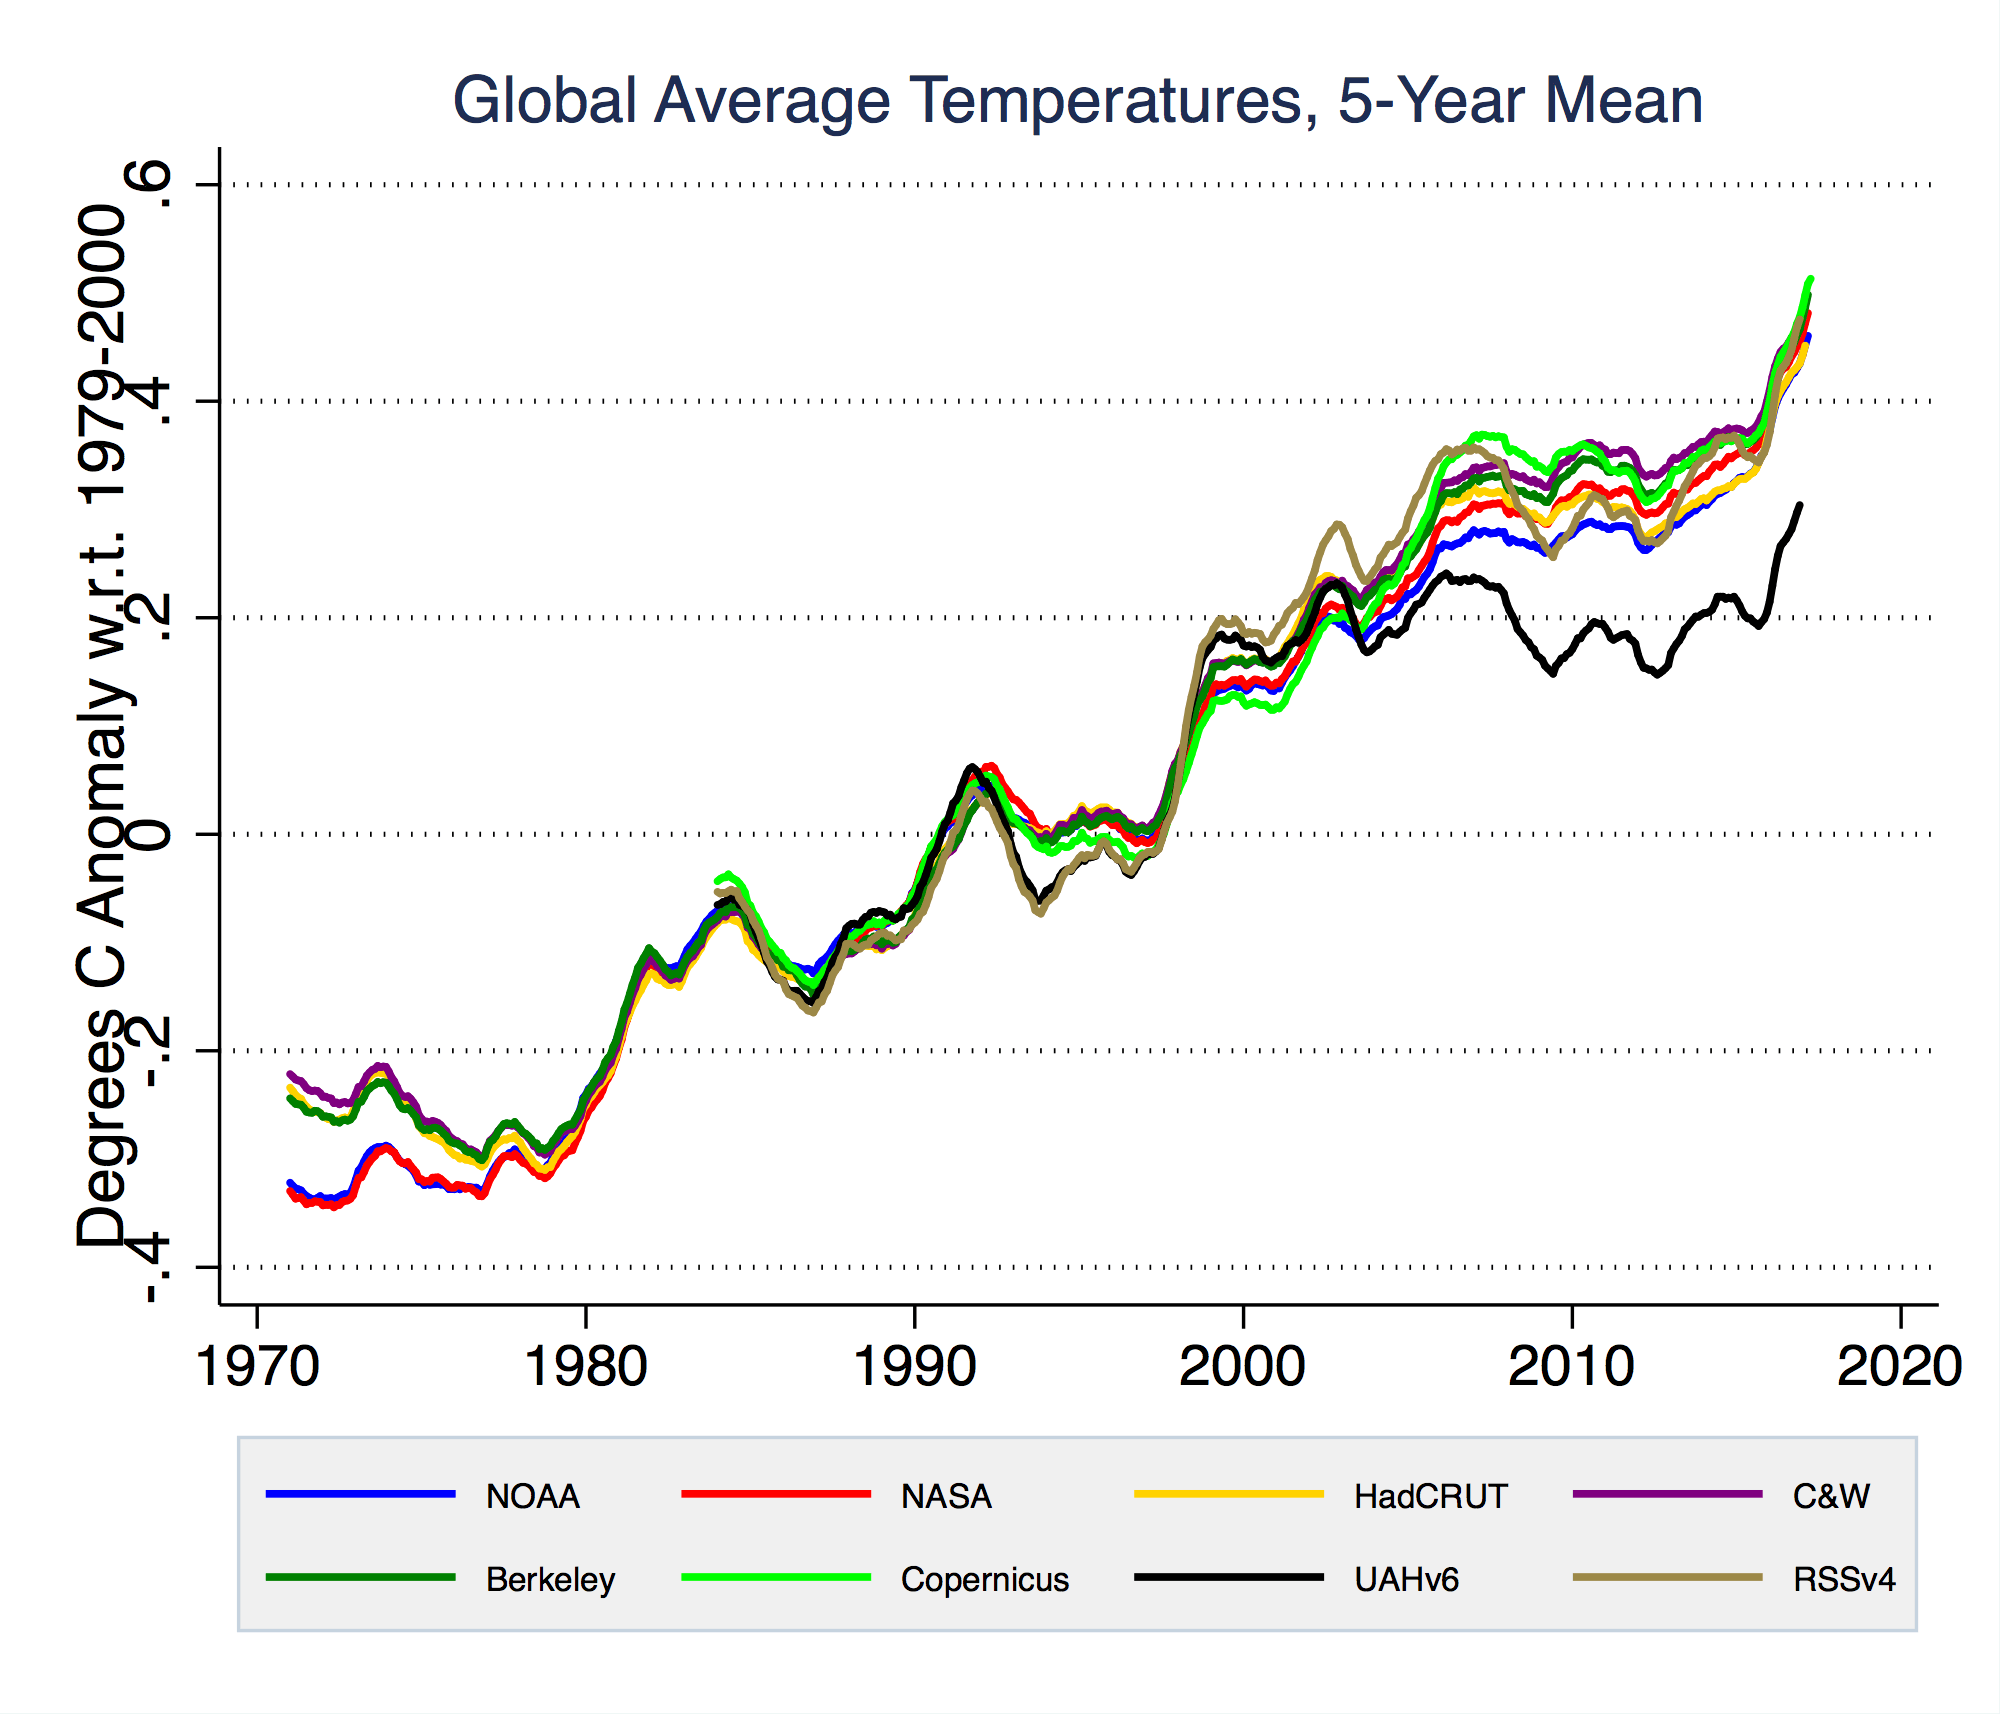
The differences between these records and their causes is an area of active research, though we have strong reason to suspect that the surface record is quite accurate.
“This means the global temperature trend has now shown no further warming for 19 years”
Research fellow, University of Melbourne
This is both cherry-picking of the data (starting with 1998), and not correct anyway.
Associate Professor, University of Utah
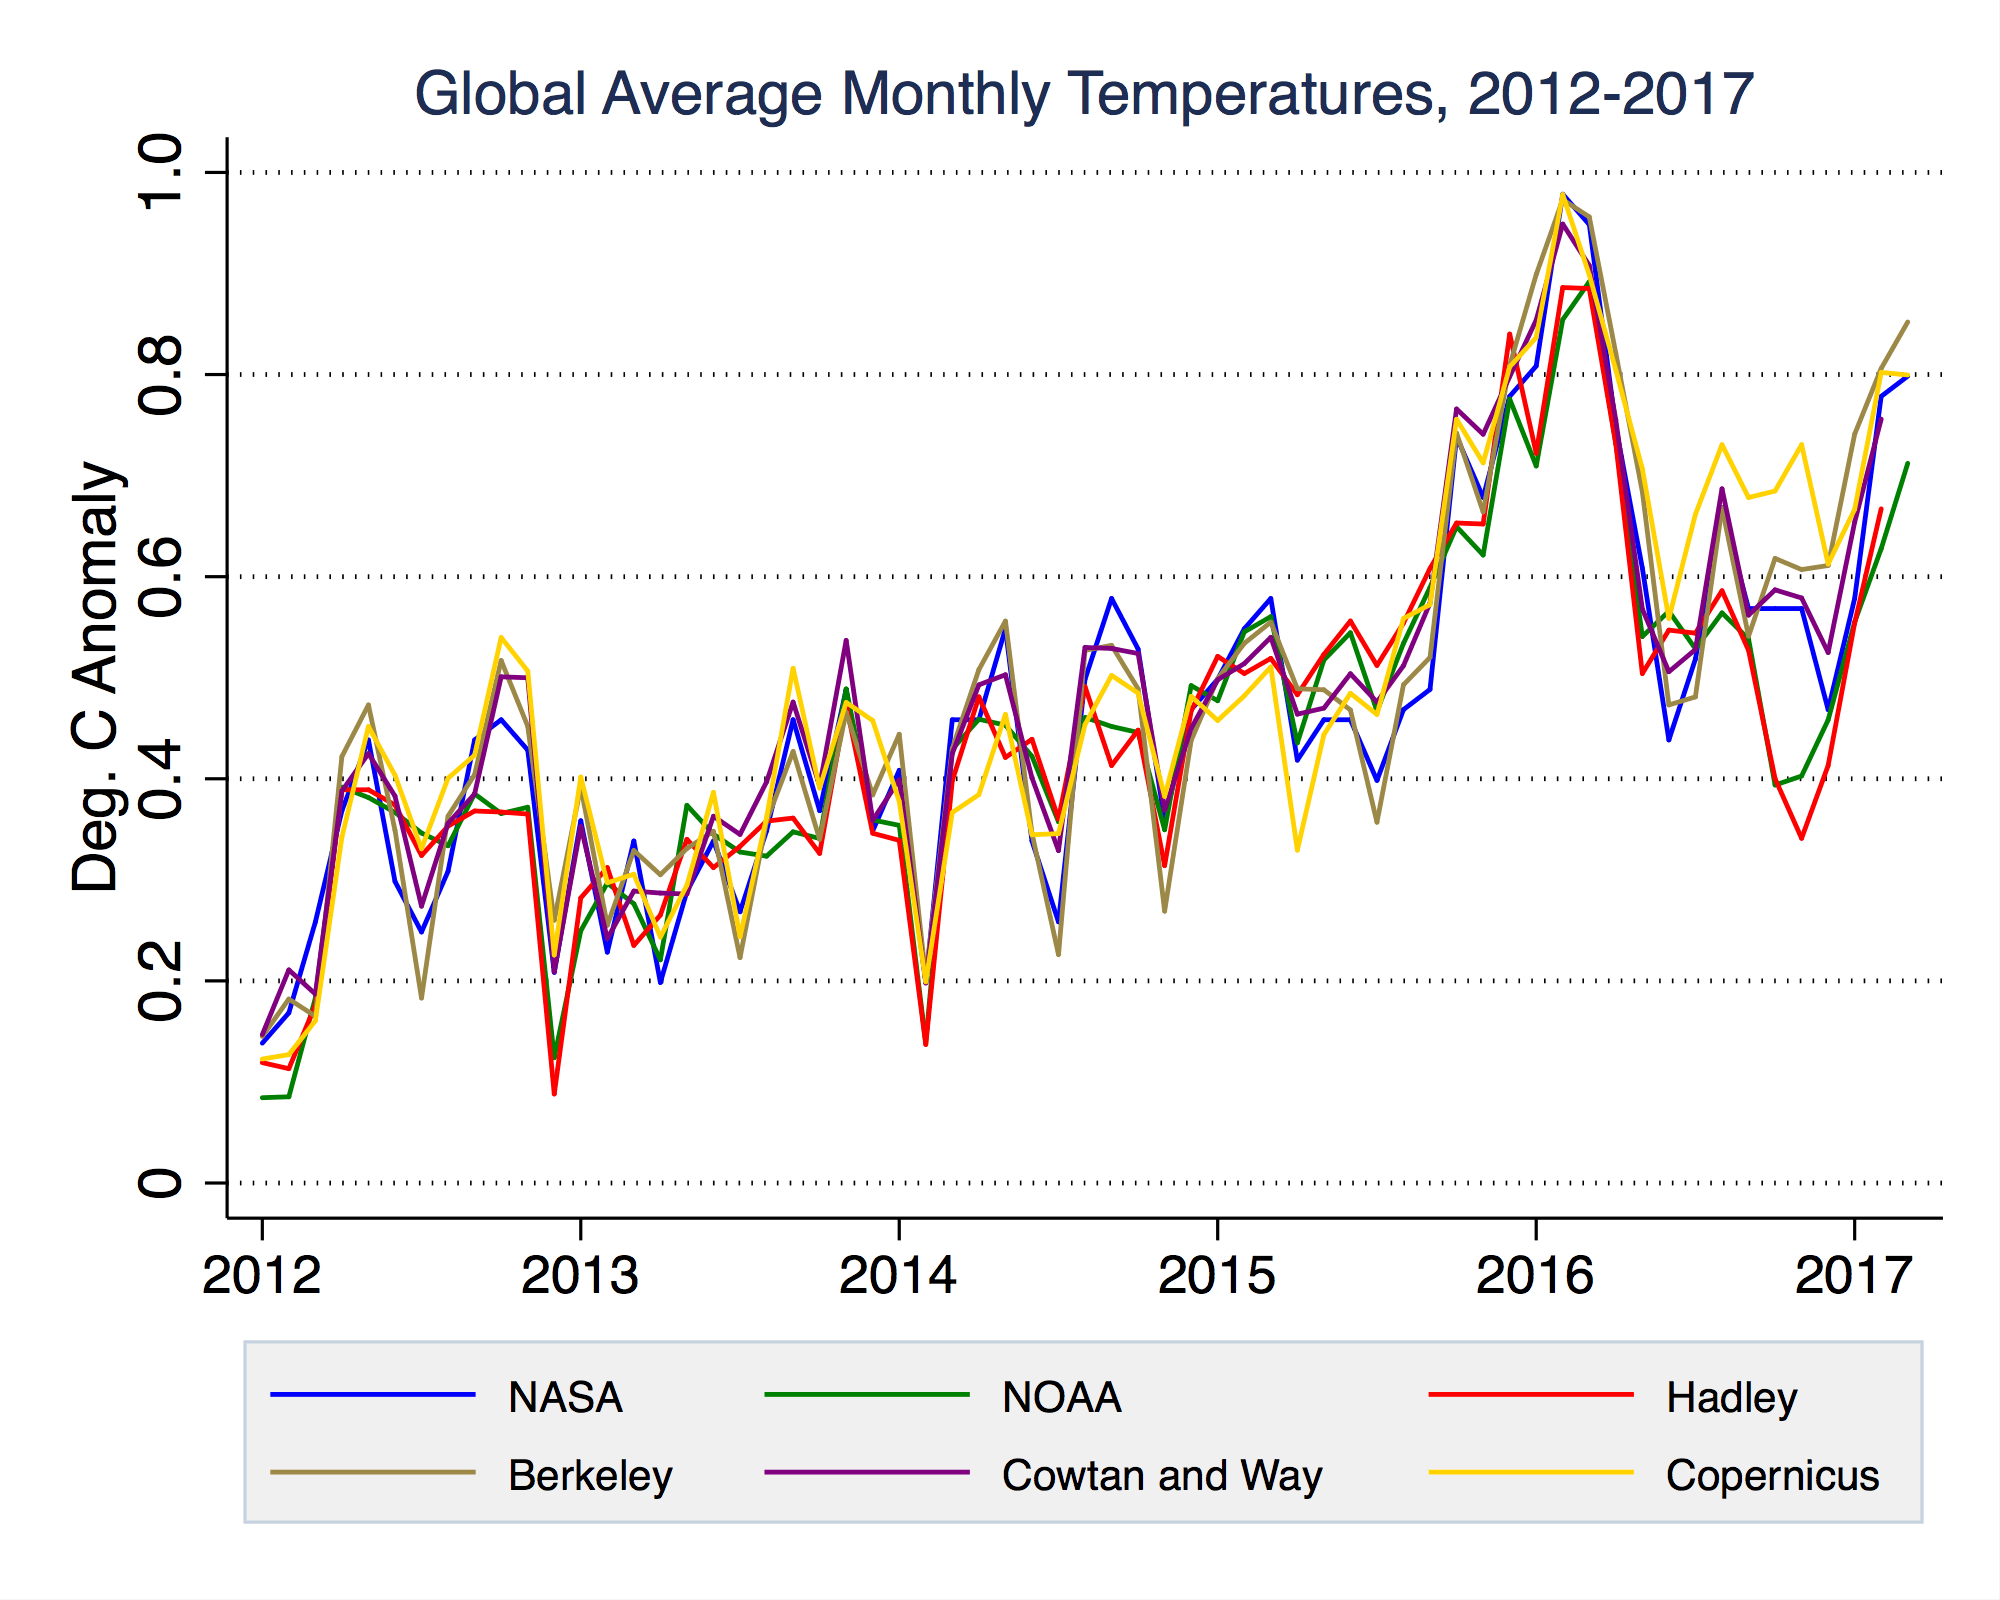
This is blatantly false. Examine the trend here:
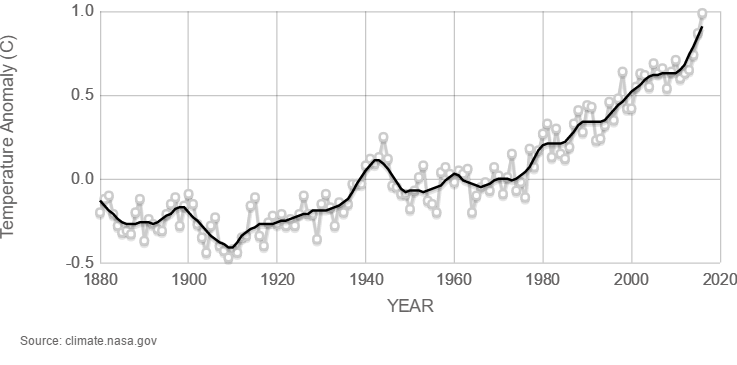
Furthermore, a short time period of a few months in 2017 cannot say anything whatsoever about the long-term change in climate.

Associate Professor, Oregon State University
This statement is false. Global temperatures continue their long-term warming trend.
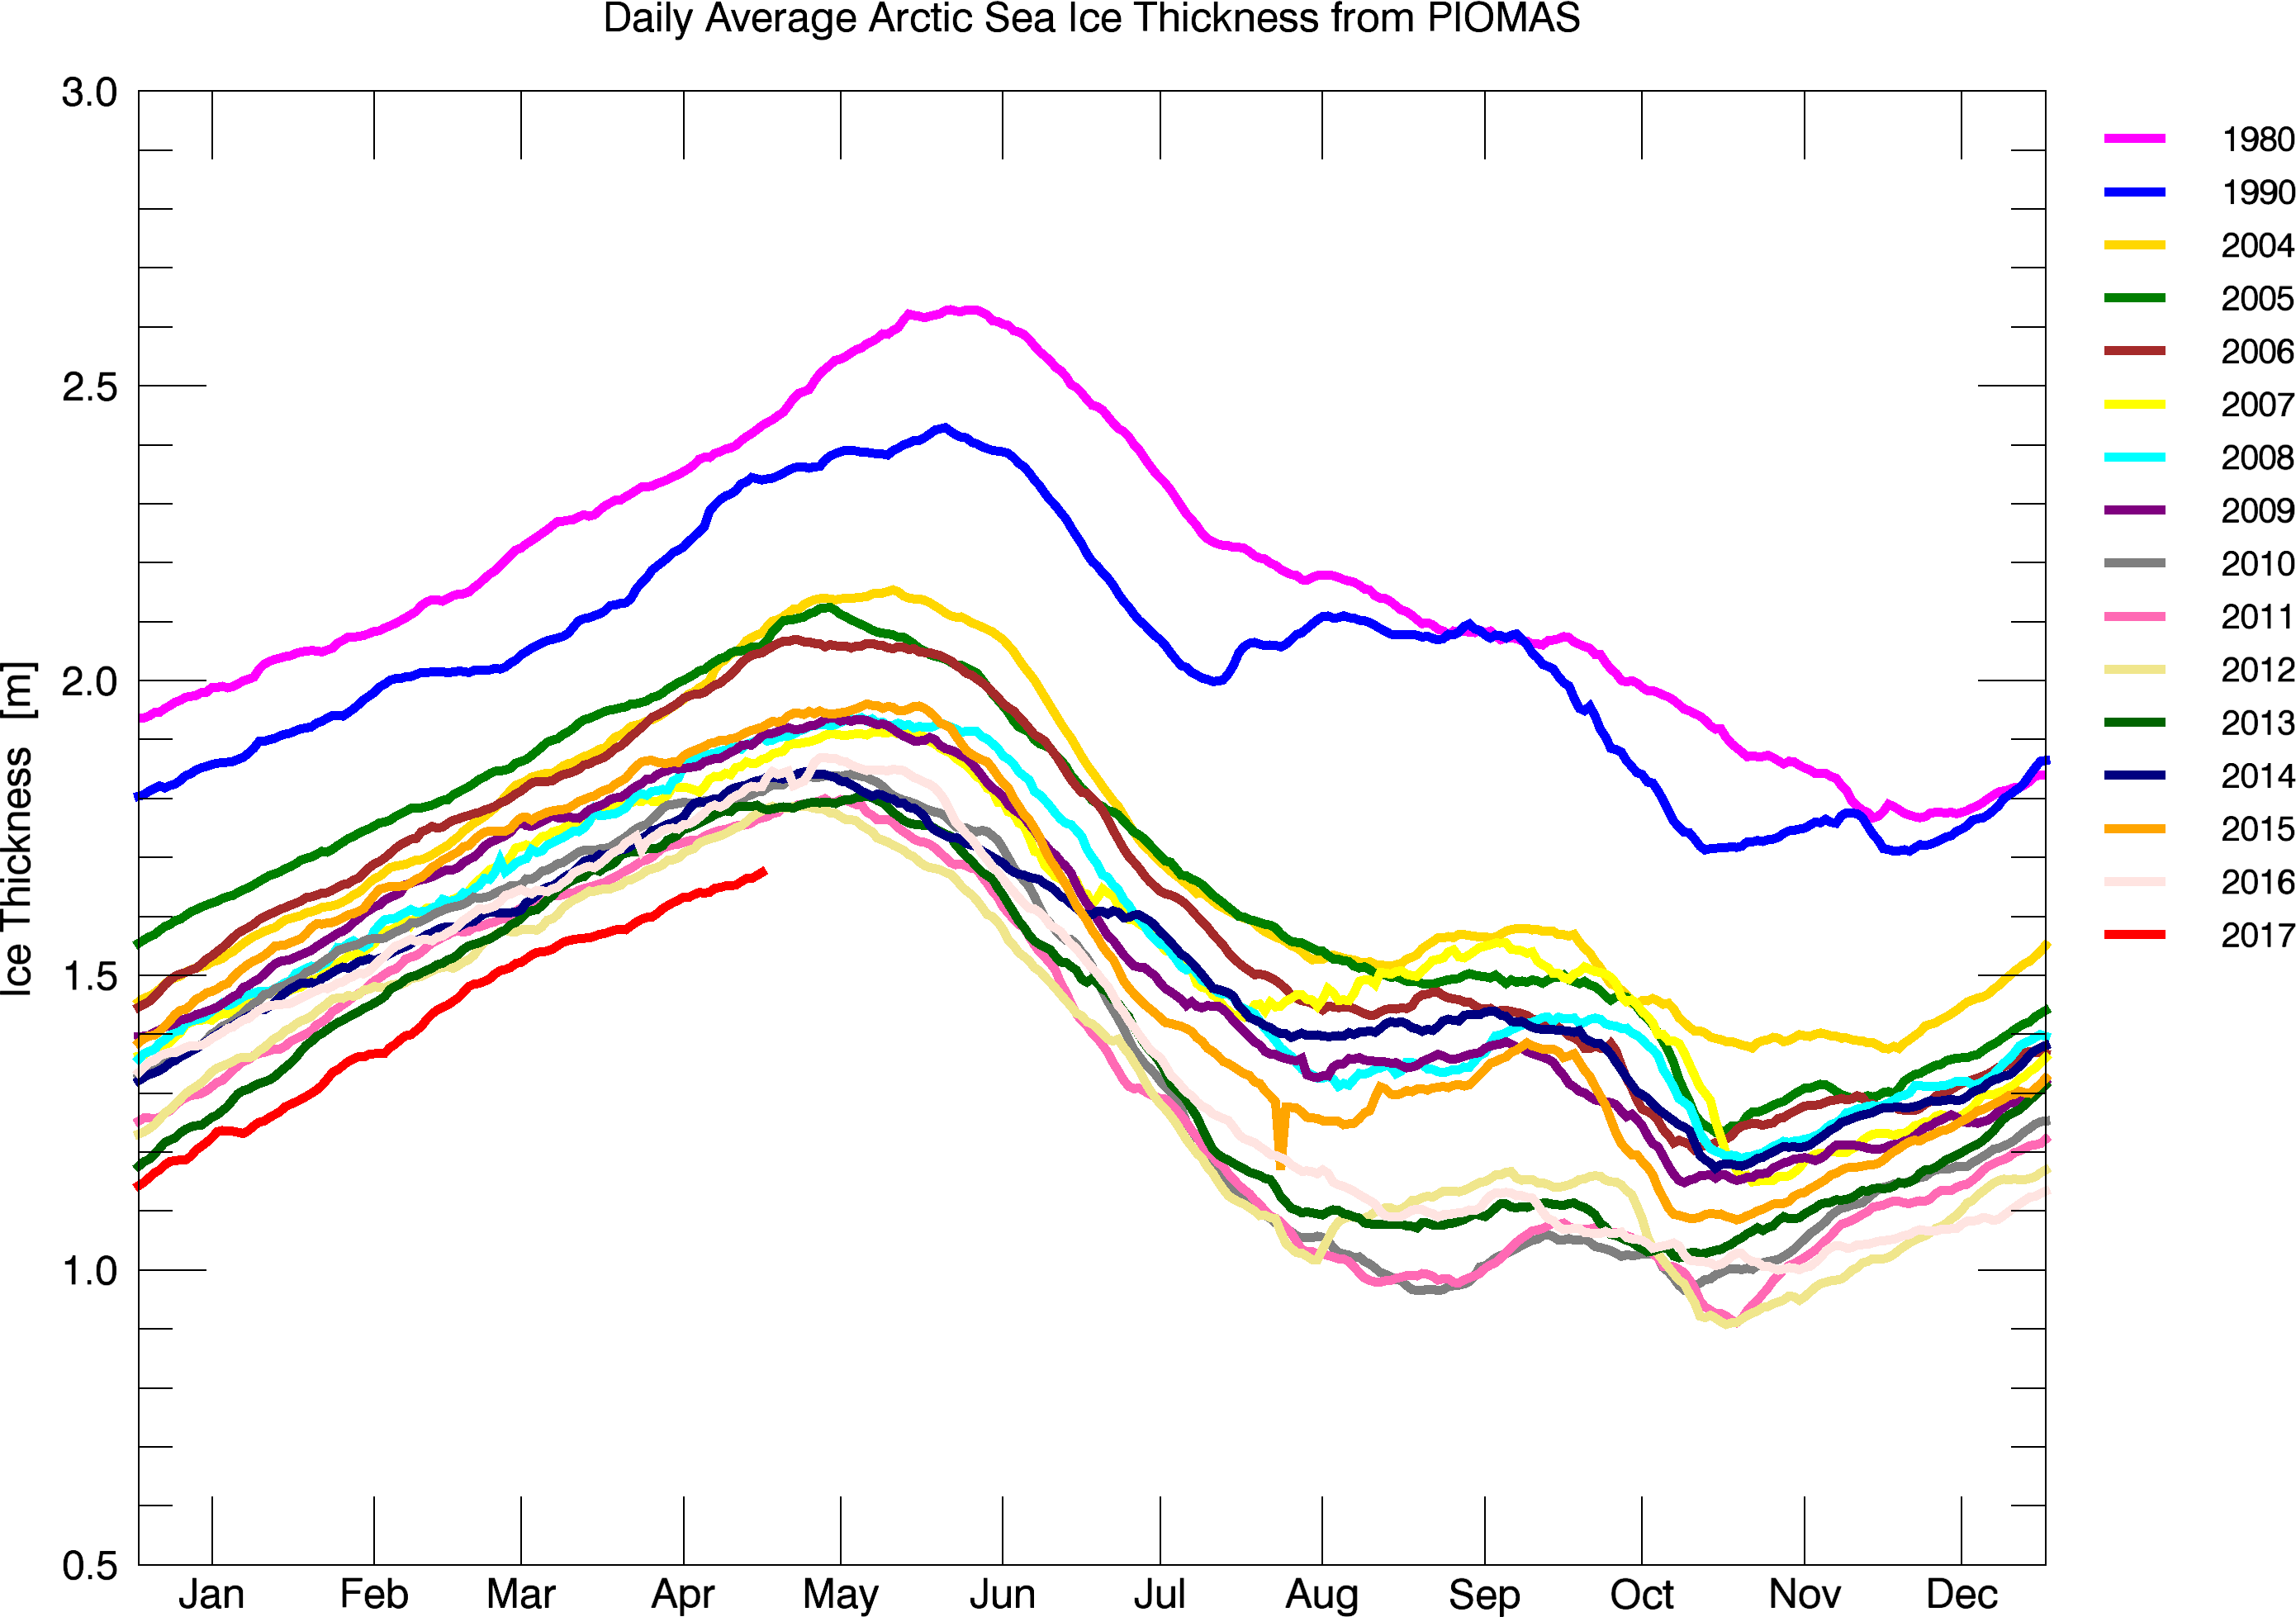
“Arctic sea ice is thicker than ever”

Postdoctoral associate, NASA Goddard Space Flight Center
PIOMAS (a model constrained by surface temp observations) shows the ice volume tracking lower than ever for this time of the year. Most recent direct observations show the sea ice is still a lot thinner than it was in previous decades.
Senior Scientist, Potsdam Institute for Climate Impact Research (PIK)
This is wrong. Arctic sea-ice thickness in 2017 is actually at its lowest values compared to earlier years for which we have sufficient data coverage, see:
“In April the extent of Arctic sea ice was back to where it was in April 13 years ago”

Principal Research Fellow, National Centre for Atmospheric Science
In the NSIDC dataset, April 2017 was actually the equal of the lowest Northern Hemisphere extent on record (tied with 2016 on 13.83 M km2).
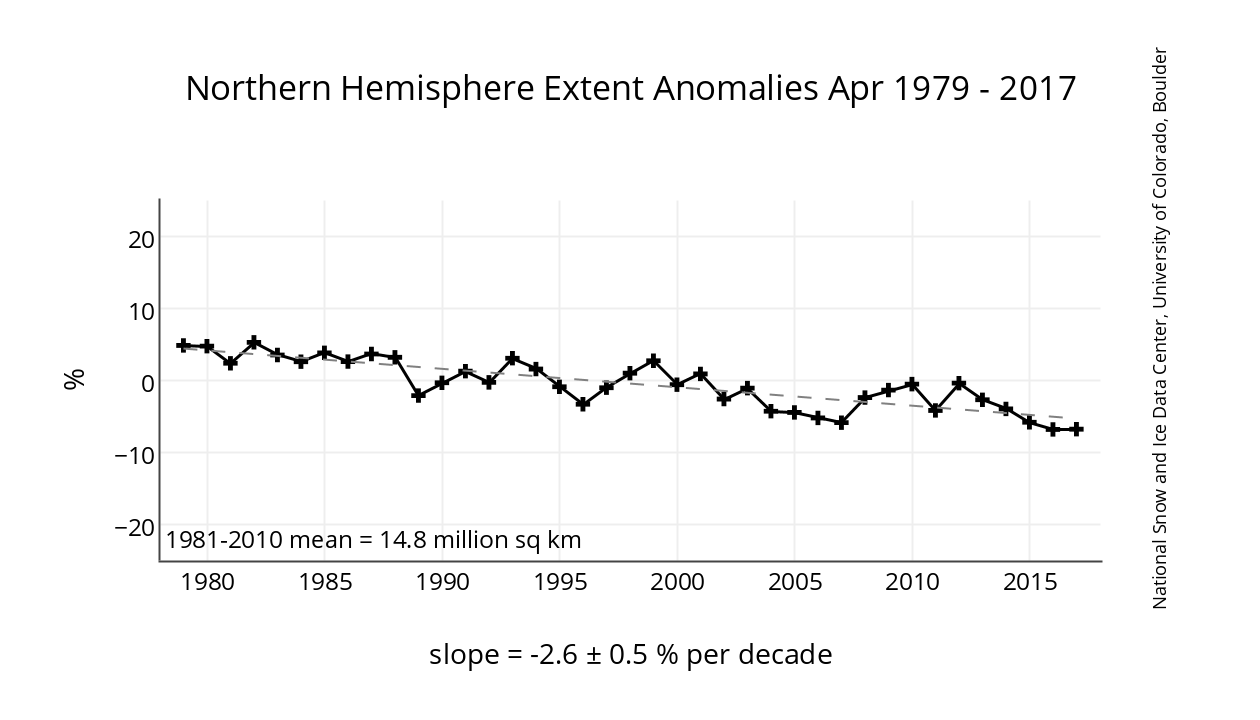
This statement is misleading. Arctic sea ice extent in April was significantly lower than the long-term average—but varies substantially from day to day and year to year as processes such as wind and waves and short-term weather variability have a substantial effect on sea ice extent, particularly at this time of year. However, over the long term since 1979, the April sea ice extent has declined by around 3% per decade, at other times of the year the decline is even more marked. This is an example of cherry-picking dates in order to try and state that the sea ice is recovering (it’s not). It also confuses climate variability with trends over short periods.
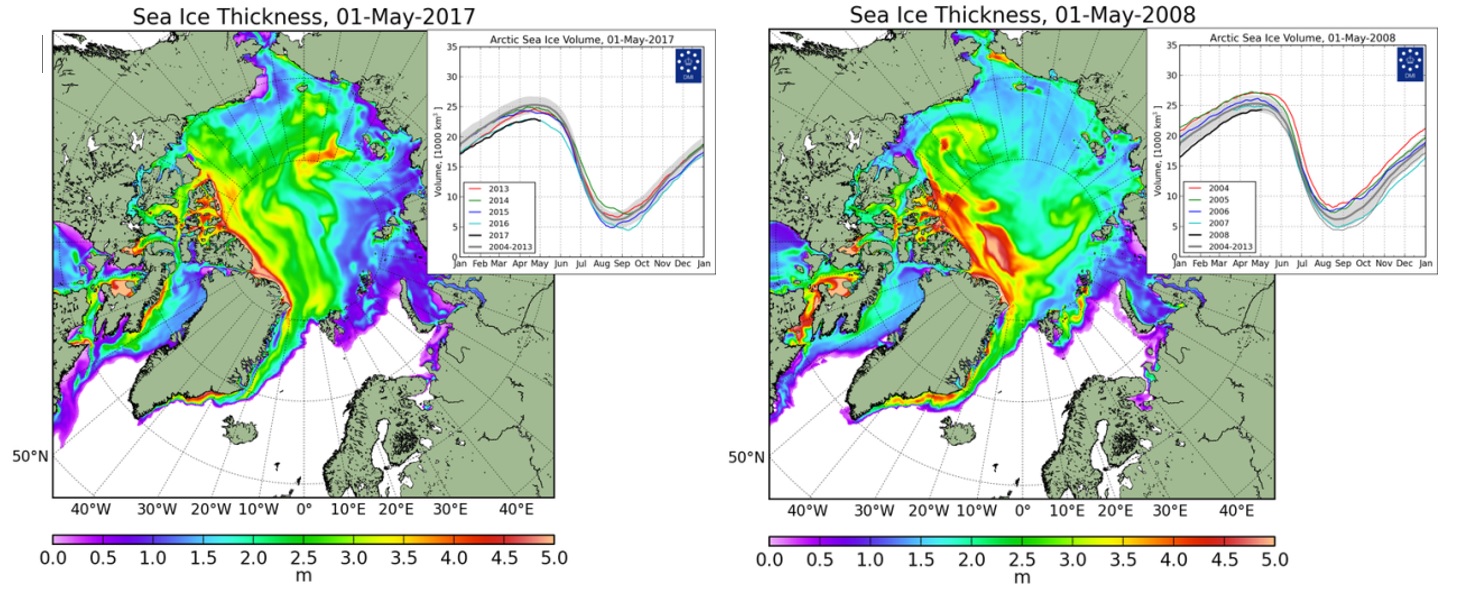
“Furthermore, whereas in 2008 most of the ice was extremely thin, this year most has been at least two metres thick.”
Climate Scientist, University of California, Los Angeles
Arctic sea ice volume has actually exhibited record thinness so far during 2017—beating the previous record years of 2012/2016 by a wide margin. Another nice visualization by Zachary Labe illustrates this quite clearly:
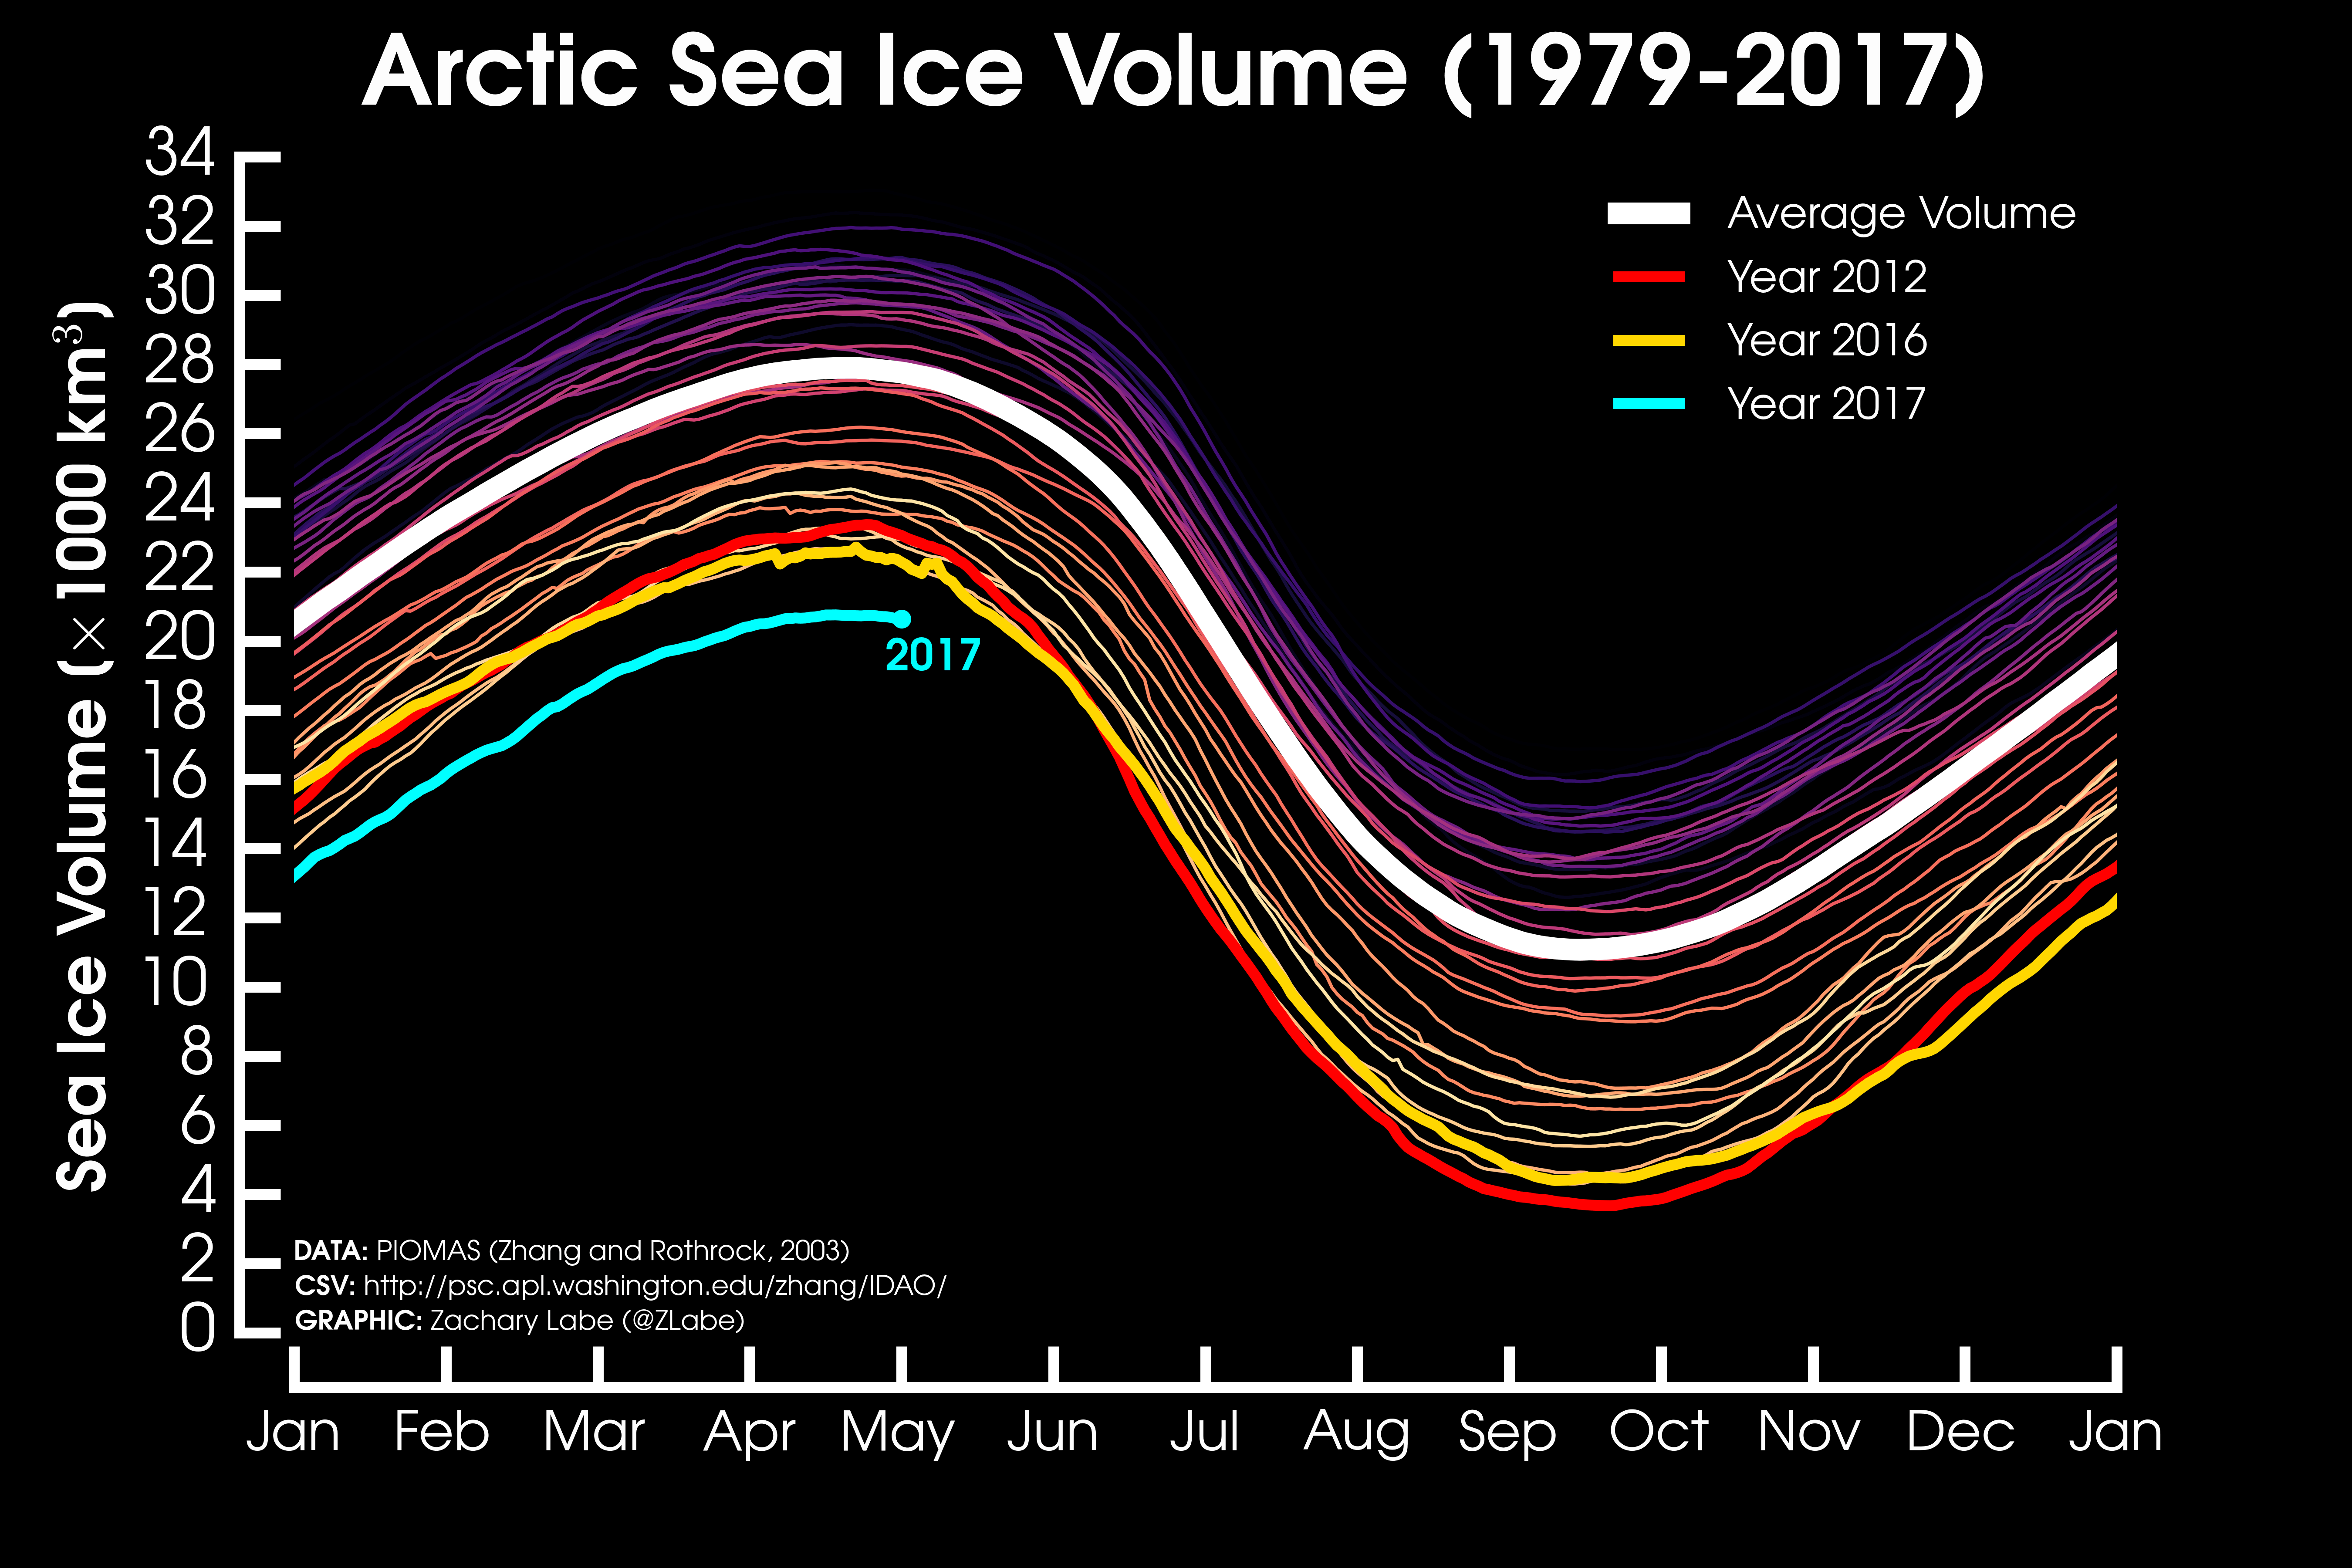
“Whereas in 2008 most of the ice was extremely thin, this year most has been at least two metres thick.”
Ruth Mottram, Martin Stendel, Peter Langen, Danish Meteorological Institute
This is a misleading statement, as “extremely thin” is not defined and what is also not stated is that there were also substantial areas of much thicker ice in 2008. If we look at the total ice volume, which averages these effects out, on 1st May 2017 it was about 6% lower than the ice volume for the same date in 2008 according to the operational ocean and sea ice model. Again, in addition to air and ocean temperature, ice thickness depends on winds and ocean currents and shows large variations from year to year so choosing two years arbitrarily is misleading without considering the long term trend.
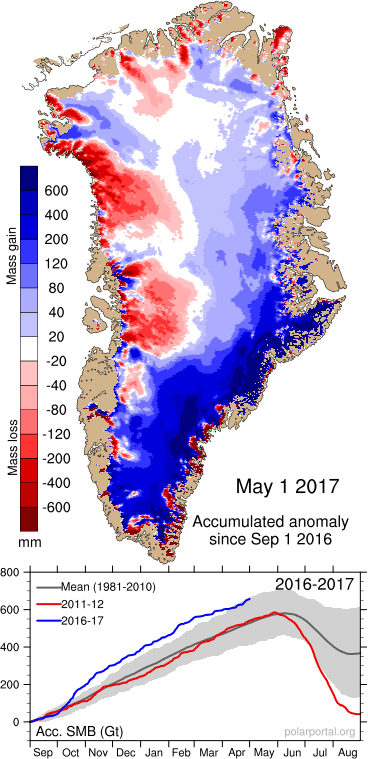
“The Greenland ice cap last winter increased in volume faster than at any time for years.”

Assistant Professor, University of Colorado, Boulder
This is not per se completely incorrect, but the author does not tell us the whole story. The author refers to the growing of the ice sheet volume through snowfall throughout winter. The snow accumulated on Greenland in past winter (September-April) has indeed been remarkably high:
However, this does not imply that the volume of the ice sheet is increasing, because (1) the ice sheet also loses ice through discharging icebergs; it is the difference between snowfall-driven growth and solid ice discharge that determines if the ice sheet gains or loses volume, and (2) the snow that accumulated during the winter will (at least partly) melt over the summer. That’s why we analyse changes to the ice sheet volume/mass on (at least) annual time scales. Only after the summer we will know how much of the accumulated snow has (not) been melted.
uring the past years, the amount of melting has been record-high, and much of snow that accumulated over the winter melted and ran off into the ocean. Concurrently, ice discharge continued, so the Greenland ice sheet LOST considerable volume. We will know in September how much the ice sheet has changed volume this year.
Two additional remarks:
(a) The word “faster” should not have been used here. We are not talking about the rate of speed, but rather about the total change in volume. Also, it is easier to talk about “mass changes” than “volume changes” since the former is not sensitive to the density of the medium we are talking about (snow has a lower density than ice!).
(b) The enhanced snowfall, ironically, is most probably also a signal of the strongly warming Arctic: as the atmosphere warms, it contains more moisture, and generates more precipitation. Also, record-low fall and winter sea ice extent led to large streaks of open water that might have contributed to additional moisture loading of the air.
Here the author confuses short-term variability (i.e., weather) with a significant change to the Greenland ice sheet. Until a full annual cycle is considered, it is impossible to say if the volume is increasing or not. We can confirm that there has been a record amount of snow and rain over Greenland this winter, most of it fell in October due to extra-tropical hurricane Nicole. However this “extra” winter snowfall is not yet part of the Greenland ice sheet but a snow layer sitting on top of it and the extra gain in snow may be easily wiped out by a warm sunny summer. The summer is by far the most important time of year for the ice sheet—it determines if the ice sheet will grow or shrink so we will not know until September if this winter’s extra snow will have any effect on the overall ice sheet mass budget. Furthermore, we should bear in mind that extra snowfall in Greenland is actually predicted in most climate models, (a warmer atmosphere = more moisture = more snowfall in Greenland) as a consequence of climate change. We should also note that almost all of the additional above average snow fell in the East and South, and north-western Greenland actually has less snow than usual (which you can see in the figure above).
“Scientists are also expecting a ‘huge reduction’ in solar activity for 33 years between 2020 and 2053 that will cause thermometers to crash.”
Senior Scientist, Potsdam Institute for Climate Impact Research (PIK)
Solar activity cannot be predicted. While there are some indicators that future solar activity might indeed be lower, this will have little effect on global temperatures. See, for example, this RealClimate post based on Feulner and Rahmstorf (2010)*.
The results have been confirmed by a number of follow-up studies.
- Feulner and Rahmstorf (2010) On the effect of a new grand minimum of solar activity on the future climate on Earth, Geophysical Research Letters

Senior scientist, The Norwegian Meteorological institute
This statement about future solar activity levels between 2020-2050 is completely baseless. Only a few years ago, the scientists were surprised by the recent reduction in the current activity.
“He said: ‘We have had five warming cycles since about 900AD, each followed by a dramatic cooling cycle.’”
Senior Scientist, Potsdam Institute for Climate Impact Research (PIK)
The global (or even hemispheric) temperature drops during past grand solar minima were actually small. Furthermore, there is increasing evidence that slightly cooler episodes like the “Little Ice Age” were predominantly caused by volcanic eruptions. See, for example, this summary of Miller et al (2012)*.
- Miller et al (2012) Abrupt onset of the Little Ice Age triggered by volcanism and sustained by sea-ice/ocean feedbacks, Geophysical Research Letters