- Climate
Popular “Friends of Science” video promoted by Youtube presents long list of climate myths
Reviewed content
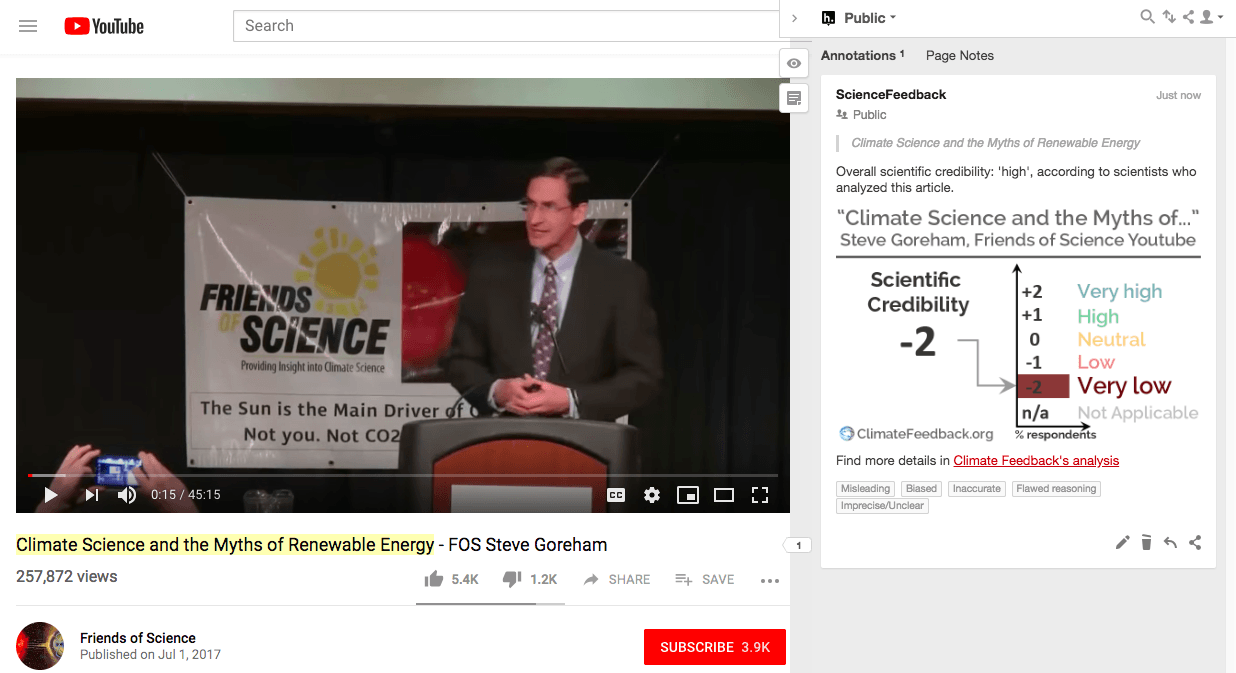
Headline: "Climate Science and the Myths of Renewable Energy - FOS Steve Goreham"
Published in YouTube, Friends of Science, by Steve Goreham, on 2017-07-01.
Scientists’ Feedback
SUMMARY
This video of a talk by author and speaker Steve Goreham, posted by the YouTube channel “Friends of Science” has been viewed over 250,000 times and has been widely promoted by Youtube recently. In it, Goreham claims that climate change is not dangerous, and is not caused by humans.
Scientists who reviewed the talk found that it was comprised of a litany of common myths about climate science. Goreham misrepresents global temperature data, the physics of the greenhouse effect, and the factors controlling sea level rise, among many other things, as explained below by scientists.
UPDATE: As of July 11, 2019 the video has amassed more than 450,000 views on Youtube and keeps being shared regularly on Facebook. This illustrates that online misinformation can generate long-lasting damages.
See all the scientists’ annotations in context. You can also install the Hypothesis browser extension to read the scientists’ annotations in context.
REVIEWERS’ OVERALL FEEDBACK
These comments are the overall assessment of scientists on the article, they are substantiated by their knowledge in the field and by the content of the analysis in the annotations on the article.

Professor, Potsdam University
The video presents a litany of the usual climate denier talking points, none of which hold any water. It is full of outright false claims and does not even shy away from presenting a fake TIME magazine cover that supposedly warned of an ice age.
“Friends of Science” is an advocacy group “largely funded by the fossil fuel industry”, according to Wikipedia. Already its name is intended to mislead.

Research Scientist, University of Colorado, Boulder
The information in this video is consistently false, using some correct ideas (e.g. Greenland is thinning at edges and thickening in the center) to build up incorrect explanations (e.g. so overall Greenland is not changing much). The video builds scientifically incorrect understandings for a wide variety of topics.

Assistant Professor, San Jose State University
The video is of very low scientific quality. It stitches together dozens of unoriginal myths about climate science that have been debunked over and over again.

Research Associate, Colorado State University/NASA JPL
This video is shameful and full of well-known tricks that deceive people about global warming. Almost every statement is false or misleading. Radiometer measurements of Earth’s atmosphere confirm CO2‘s heating effect just as expected, and other instruments rule out the Sun or volcanoes. There are specific “fingerprints” in patterns of warming that match CO2 caused warming and we have measured increasing water vapour in the air in response, just as predicted decades ago. This video is an embarrassment.
Notes:
[1] See the rating guidelines used for article evaluations.
[2] Each evaluation is independent. Scientists’ comments are all published at the same time.
Key Takeaways
The statements quoted below are from Goreham’s video; comments are from the reviewers (and are lightly edited for clarity).
“There is no empirical evidence that increasing greenhouse gases are the primary cause of Global Warming”
This is not true.
The primary empirical evidence that greenhouse gasses cause global warming is the absorption (as a function of wavelength of radiation) of gasses like CO2, CH4 and N2O. This was discovered in 1859 by John Tyndall and has become a part of fundamental physics. Anyone can check this empirical relationship at any time with an absorption spectroscopy device.
The empirical evidence that increases in greenhouse gas concentrations (from fossil fuel burning) are the primary cause of century-scale warming is that observed global temperatures have risen in line with what would be expected from the observed increase in greenhouse gas concentrations and observations of natural drivers of climate change (e.g. solar output and volcanic eruptions) indicate that natural drivers are not causing warming.
The initial claim that there is no empirical evidence is unfalsifiable. What evidence would be required? A manipulation of multiple identical planets, one group with fossil fuel burning etc, the other group with no humans. There is empirical evidence that CO2 is increasing, there is empirical evidence that this is from fossil fuel burning, there is evidence that this is altering the radiative balance of the planet, there is empirical evidence that global temperatures are increasing. The IPCC reports have all the latest references for these various evidence streams.

Senior scientist, The Norwegian Meteorological institute
The greenhouse effect exists on other planets in the Solar System and explains why planets like Venus have such a hot surface. The big picture is explained in the paper “A mental picture of the greenhouse effect”*, which also presents some empirical evidence contrary to the false statement in the video. The challenge, rather, would be to explain why increased levels of greenhouse gases potentially would not influence the greenhouse effect. (It does).
- Benestad (2016) A mental picture of the greenhouse effect, Theoretical and Applied Climatology
“Today climate scientists are obsessed with the level of carbon dioxide in the atmosphere, a very very small part of the overall picture. Carbon dioxide is a trace gas.”
The small percent of CO2 by volume in the atmosphere (what makes it a trace gas) is utterly irrelevant in terms of its radiative properties and thus its effect on global temperature.
Climate scientists pay special attention to CO2 because its radiative properties have allowed it to be the dominant cause of warming over the past century.
Research Associate, Colorado State University/NASA JPL
When the speaker is willing to inject such a “trace amount” of ebola or ricin into their own body I’ll believe that they were being serious with this argument.
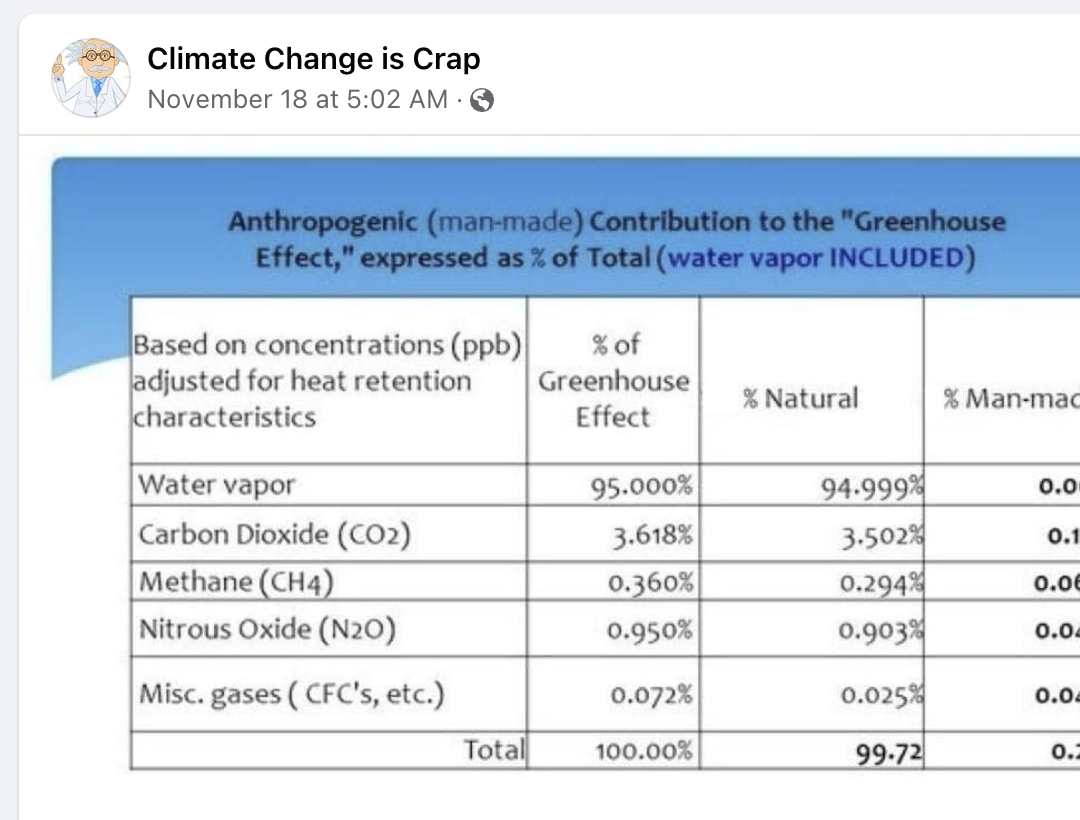
“But what is nature’s most abundant greenhouse gas? Water vapor. It’s not carbon dioxide, it’s not methane… Scientists estimate that somewhere between 75% and 90% of Earth greenhouse effect is caused by water vapor in clouds.”
Ironically, the paper that he is citing here is called “Atmospheric CO2: Principal Control Knob Governing Earth’s Temperature”[1]. The abstract explains why CO2 is the control knob even if it does not make up a majority of the current greenhouse effect:
“Ample physical evidence shows that carbon dioxide (CO2) is the single most important climate-relevant greenhouse gas in Earth’s atmosphere. This is because CO2, like ozone, N2O, CH4, and chlorofluorocarbons, does not condense and precipitate from the atmosphere at current climate temperatures, whereas water vapor can and does. Noncondensing greenhouse gases, which account for 25% of the total terrestrial greenhouse effect, thus serve to provide the stable temperature structure that sustains the current levels of atmospheric water vapor and clouds via feedback processes that account for the remaining 75% of the greenhouse effect. Without the radiative forcing supplied by CO2 and the other noncondensing greenhouse gases, the terrestrial greenhouse would collapse, plunging the global climate into an icebound Earth state.”
- [1] Lacis et al (2010) Atmospheric CO2: Principal Control Knob Governing Earth’s Temperature, Science
Research Associate, Colorado State University/NASA JPL
This calculation estimates each fraction now. If you took the CO2 out and we lost 20 % of the greenhouse effect, Earth would cool down and lots of the vapour would rain out. The amount of water vapour responds to temperature and circulation, nowadays CO2 is the driver.
“Every day, nature puts twenty times as much carbon dioxide into the atmosphere as all of Earth industries. That means that humans are responsible for about one or two parts per hundred over its greenhouse effect.”
Professor, Potsdam University
A classic misleading climate skeptic talking point which confuses the natural zero-sum turnover, which does not add anything to the atmosphere, with the net addition by human activities. A few scientifically uncontroversial facts: 1) Since the beginning of industrialization, the CO2 concentration has risen from 280 ppm (the value of the previous millennia of the Holocene) to now 405 ppm. 2) This increase by 45 percent (or 125 ppm) is completely caused by humans. 3) The CO2 concentration is thus now already higher than it has been for several million years. (Full explanation here.)
This is wrong. Nature puts in more CO2 than industry but nature also takes out exactly what it puts in (on century timescales). This means that nature puts essentially zero NET CO2 into the atmosphere. The rise in atmospheric CO2 since the Industrial Revolution has been entirely driven by human burning of fossil fuels.
Senior scientist, The Norwegian Meteorological institute
The important point is that the net effect to the CO2 exchanged between different parts leads to a rise in the CO2-concentration, which now has passed 400 parts per million. There is no doubt that the increase in the concentration is due to burning of fossil fuels—it’s easy to calculate based on the amount of oil, gas and coal that is burned, and the chemistry. A comparison between the sizes of the various fluxes between the different parts clutters the discussion. Furthermore, water vapour (H2O) has a short life time in the atmosphere compared to CO2. It rains out after a few days whereas CO2-levels stay for centuries.
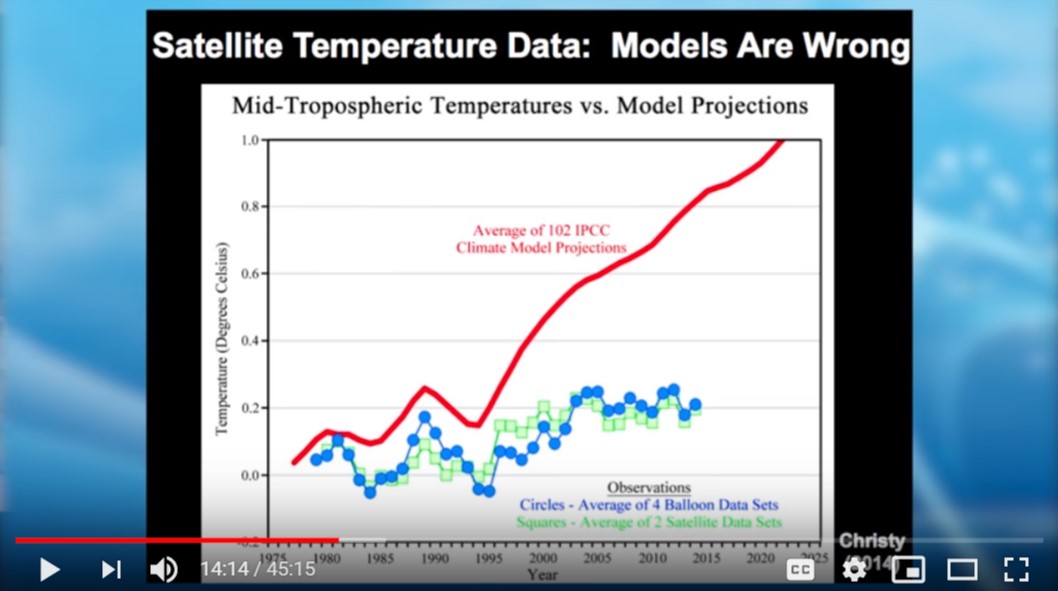
“So it’s clear now we’re not seeing dangerous global warming, and the climate models are wrong.”
Research Associate, Colorado State University/NASA JPL
We have done a bunch of comparisons with models and observations. The surface observations are more reliable because there are so many of them, and satellite infrared (think Predator vision) backs them up.
We checked from the 1860s to today and it’s remarkable how well the observed warming matches the modelled warming*.
- Richardson et al (2016) Reconciled climate response estimates from climate models and the energy budget of Earth, Nature Climate Change
- Hausfather et al (2017) Assessing recent warming using instrumentally homogeneous sea surface temperature records, Science
This graph has a lot of problems (as explained here). But one problem is that humans and ecosystems live on the Earth’s surface and this is data for the mid-atmosphere. Observations of surface temperature through 2018 are more or less in the center of the climate model predicted range.
Senior scientist, The Norwegian Meteorological institute
The claim is false: the graph shows a misguided comparison between (1) the average of climate model simulations for a part of the upper atmosphere that is strongly affected by the clouds and the Hadley cell in the Tropics, (2) temperature derived from satellite measurements, and (3) balloon data. This exercise fails on statistical terms, since the comparison should be carried out between all individual climate models (to show the their spread)—one cannot expect the average value to match the one that is measured, just as one does not expect that the temperature in Washington always to be the same as the mean temperature in Washington. There are also issues with using the satellite data as a reference, since satellites do not measure temperature directly. They measure light and make use of algorithms based on the same principles, as those used in the climate models, to estimate the temperatures. Hence, the satellite data are also model results, and the comparison between the two is like comparing different models. The satellite data data have some issues regarding how different records are stitched together from different missions and how the signal is affected by clouds and other factors. The balloon (radiosondes) do not give a good representation over the upper air, as there are few of them. More information.
[Read more about this incorrect claim that climate models have overestimated recent warming]
“If we double atmospheric carbon dioxide[…] we’d only raise global surface temperatures by about a degree Celsius.”
Research Associate, Colorado State University/NASA JPL
More like 3 degrees, but only being 200% wrong is pretty good by the standards of this talk.
Dozens of studies over the past several decades have calculated this number from every perspective that scientists can imagine the best estimate continues to fall around 3 degrees Celsius, with a vanishingly small chance that it could be as low as 1 degree Celsius.
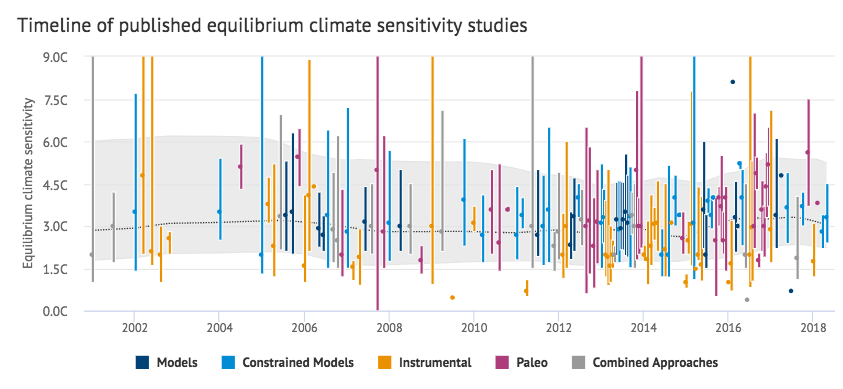
Figure – Compilation of climate sensitivity studies by Carbon Brief.
“The idea that the much smaller carbon dioxide cycle is now controlling the water cycle is not very likely.”
Senior scientist, The Norwegian Meteorological institute
This statement does not appreciate our current understanding. To understand this, one needs to model the climate and how it matters for the atmospheric circulation and the planetary energy balance. In some regions, it gets drier (typically the subtropics) and in others there is increasing precipitation (typically the mid-latitudes). There are some indications that the rain on a global scale is getting more intense and concentrated over a diminishing area*.
- Benestad (2018) Implications of a decrease in the precipitation area for the past and the future, Environmental Research Letters
“So the bottom line of all this is that climate change is natural, not man-made. I don’t have a chance to go into a lot of the details, but it’s due to natural cycles of Earth that are probably driven by the Sun. Man-made greenhouse gases play only an insignificant role.”
Senior scientist, The Norwegian Meteorological institute
We know for sure that climate change is not caused by changes in the Sun because there have been no long-term trend in the solar behavior that can explain the global warming.
The best estimate that we have is that 100% of the warming since the mid 20th century is human-caused [see e.g. this review or this article]. This is because the natural causes of climate change that are active on these timescales should have either caused cooling or no change in temperature without human influence.
Research Associate, Colorado State University/NASA JPL
If anything, the Sun has cooled in recent decades. That was reported in 2007[1]. And new satellite data says it has stayed cooler.
- [1] Lockwood and Fröhlich (2007) Recent oppositely directed trends in solar climate forcings and the global mean surface air temperature, Philosophical Transactions of the Royal Society A
“Climate scientists are telling us it’s likely we’re going to be in for a period of cooling.”
Professor, Potsdam University
Climate scientists are telling us no such thing. Questionable “climate skeptics” are again and again predicting a coming cooling, which then fails to materialise.
Senior scientist, The Norwegian Meteorological institute
No. The effect of a cooler Sun is smaller than the increased forcing from higher levels of greenhouse gases.
“Of course climate change is real, climate has been changing for all of Earth’s history”
Professor, Potsdam University
I recommend Prof. Katharine Hayhoe’s nice short summary: How do climate scientists know that climate change is real and caused by humans?
All climate scientists agree with this statement. The primary concern about contemporary global warming is that the change in global climate is thought to be occurring roughly 10X faster than previous major climate changes (with the exception being the decades after major asteroid/comet impacts).
Research Associate, Colorado State University/NASA JPL
And if you think that this somehow means that current global warming is not caused by humans, I guess you agree with this: Barcelona scored goals all through their history, even before Lionel Messi was born! Therefore Lionel Messi can’t score goals. (Or for American readers: the Rams scored touchdowns all through their history even before they signed Todd Gurley. Therefore Todd Gurley can’t score touchdowns.)
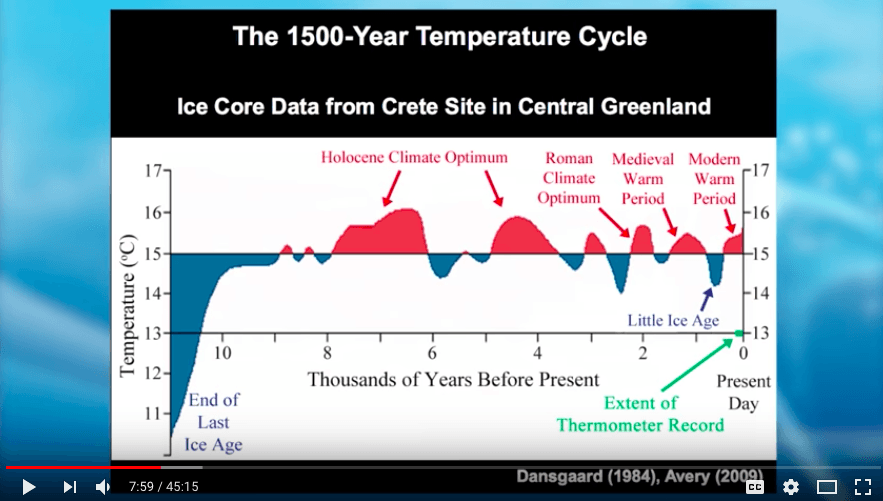
“temperatures rise and they fall, and they rise and they fall… and for the last 400 years we’ve had a gentle warming as we’ve been coming out of the little ice age.”
Changes in global temperature require global energy imbalances – they don’t happen by magic. We understand a lot about why global energy imbalances have occurred over the past 10,000 years (it mostly has to due with changes in solar output and volcanic aerosol concentrations). We also understand that the current large energy imbalance that is causing rapid century-scale warming has come about because of persistently rising atmospheric greenhouse gas concentrations from fossil fuel burning.
“the record refers to the thermometer record, which is only a 130 years long…That is very misleading: that ignores all the period over the past 10,000 years when it was warmer than it is today”
This graph does not actually show the “modern warm period” since it ends before 1950. Also, it is only for Greenland (not a global record).
Global reconstructions of temperature over the past 10,000 years indicate that we are experiencing much more rapid warming than previous periods and are currently exiting the range of temperatures experienced over the past 10,000 years.
“Where we have a glacier today, a thousand years ago we had a forest. It was warmer a thousand years ago than it is today.”
Senior scientist, The Norwegian Meteorological institute
The statement “it was warmer a thousand years ago than it is today” or 5,000 years ago has no good evidence—the discussion about Mendenhall glacier and how it reached a forest has a local perspective and is more complicated. Glaciers respond to not just temperature, but also precipitation and the wind directions. It shows that there are local/regional variations in climate and that the climate is sensitive to changing forcings/factors.
I can find no evidence of the Bradshaw reference he’s referring to. The closest I can come to is that he is referencing a photo in an online article in Live Science. That’s not to say that it’s not in the literature somewhere, just that the reference he’s using is not from primary literature.
“Temperatures cooled from about 1940 to 1975, and then they rose from about ’75 to about 2005 or so, and since then they’ve been flat or cooling.”
Senior scientist, The Norwegian Meteorological institute
The temperature curve from the amateur website Climate4You.org is misleading as it hides the time scales important for the case of climate change. Rather than showing a subselection of the monthly mean HadCRUT3 data, a better choice would be to show the annual mean values of the HadCRUT4 for the entire common period—also up to 2018. Also, there has not been any recent cooling.
“[The] front cover of Time and Newsweek, and many professors were teaching that we had to prepare for the coming ice age.”
Professor, Potsdam University
There never was such a TIME front cover. The picture shown is a well-known fake.
From the 1940s to the 1970s, the global surface temperature decreased very slightly. This probably occurred because over that time period the cooling effect from human produced aerosols was slightly larger than the warming effect from human produced greenhouse gasses. A minority of scientists predicted that the cooling effect from increasing aerosols would continue to outweigh the warming effect from increasing greenhouse gasses and that the climate would continue to cool. This idea received some public attention when Time magazine published an article titled “Another Ice Age?” in 1974 (the cover of Time shown in the video is a fake). Regardless, this article did not represent the views of the majority of the scientific literature at the time1. For example, a 1975 paper, published by Wallace Broecker2 contained the following abstract:
“If man-made dust is unimportant as a major cause of climatic change, then a strong case can be made that the present cooling trend will, within a decade or so, give way to a pronounced warming induced by carbon dioxide. By analogy with similar events in the past, the natural climatic cooling which, since 1940, has more than compensated for the carbon dioxide effect, will soon bottom out. Once this happens, the exponential rise in the atmospheric carbon dioxide content will tend to become a significant factor and by early in the next century will have driven the mean planetary temperature beyond the limits experienced during the last 1000 years.”
This prediction turned out to be remarkably accurate.
- Peterson et al (2008) The myth of the 1970s global cooling scientific consensus, Bulletin of the American Meteorological Society
- Broecker (1975) Climatic Change: Are we on the brink of a pronounced global warming?, Science
“So now we’re able to explain from natural factors how we’ve had the 20th Century warming. And it’s the combination of two factors: The first, we’re having a long-term, gentle temperature rise as we’ve emerged from the Little Ice Age[…] And then on top of that, we have the variations in temperature cycles of the oceans
Professor, Potsdam University
This is a false statement—no scientific study can explain modern warming in this way. “Emerging from the little ice age” is not a physical mechanism or explanation.
A recent paper demonstrates that global temperatures are hotter now than in the last 11,000 years[1]. His argument that there have been hot and cold cycles, including medieval warm period and little ice age, are likely based on regional temperature records / reconstructions rather than global temperature records / reconstructions.
- [1] Marsicek et al (2018) Reconciling divergent trends and millennial variations in Holocene temperatures, Nature
“This is the third station at the South Pole, I’m sure some of you know what happened to the other two stations[…] They were buried by snow.”
Senior scientist, The Norwegian Meteorological institute
The amount of snowfall increases with temperature as long as the temperature is below 0°C—above this temperature, it turns into rain. The Antarctica is still well below the freezing point, and increased temperatures are expected to give increased snowfall because the air is capable of holding more moisture. Likewise, the sea-ice around the Antarctica form during winter, when the temperatures still are below freezing, and are therefore not a good indicator for the global warming. The sea-ice extent is more strongly influenced by the salinity of the surface water, ocean currents and winds. The Antarctic is a continent surrounded by oceans, and there is little sea-ice in summer when the temperatures are higher. The Arctic, on the other hand, is an ocean surrounded by continents, and has sea-ice both during winter and summer. In the Arctic, there has been a decline in the sea-ice, primarily during summer when the temperature goes above the freezing point.
“This is the South Pole ice, 90% of Earth’s ice, and it’s getting thicker.”
Senior scientist, The Norwegian Meteorological institute
The Antarctic ice sheet is losing mass*.
- Shepherd et al (2018) Mass balance of the Antarctic Ice Sheet from 1992 to 2017, Nature
“Greenland is melting a little bit at the edges and getting thicker in the center, but overall the ice is perfectly rock solid, very little change.”
Research Associate, Colorado State University/NASA JPL
This is false. Greenland lost 2+ trillion tonnes of ice since 2002. (For example, see here, here, and here.)
Research Scientist, University of Colorado, Boulder
Greenland is losing ice at the edges—both through direct melt and by calving off icebergs—and it is getting thicker in the middle. However, the amount of thickening in the middle is a fraction of the loss at the edges. Instead, the loss at the edges is vastly outpacing new snow accumulation. Ice loss from Greenland has accelerated over the last 3 decades and in the recent decade Greenland has lost about 300 gigatons of ice per year (almost 1 mm of sea level rise per year). This paper[1] provides a good overview. Also, Greenland glacier ice is not ‘rock solid’. Glacier ice flows (think of it as very slow moving rivers), and ice is constantly moving from the center of the ice sheet to the edge. Change has been rapid and large.
- [1] Bamber et al (2018) The land ice contribution to sea level during the satellite era, Environmental Research Letters
“Ocean levels have been rising for the last 20,000 years[…] No climate scientist can tell you when natural sea level rise stopped and man-made sea level rise began.”
Professor, Potsdam University
False. We have good reconstructions of sea-level changes over the past millennia from sediment cores and other data sources along the world’s coastlines. At least in the past 28 centuries, global sea-level never even remotely rose as much as it did in the 20th Century. And that of course is physically exactly what is expected, given the 20th Century experienced a global warming unprecedented in previous millennia.
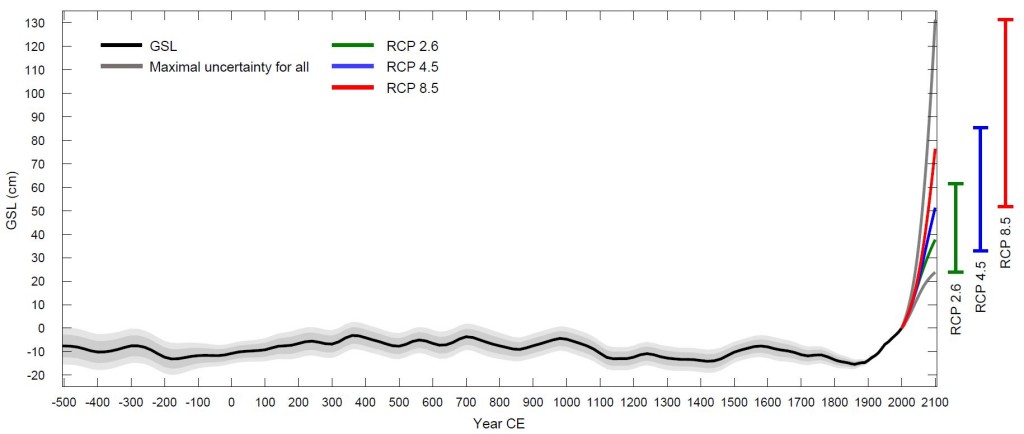
Figure – The last 2500 years of sea level together with the projections of Kopp et al. for the 21st century. Future rise will dwarf natural sea-level variations of previous millennia.
