- Climate
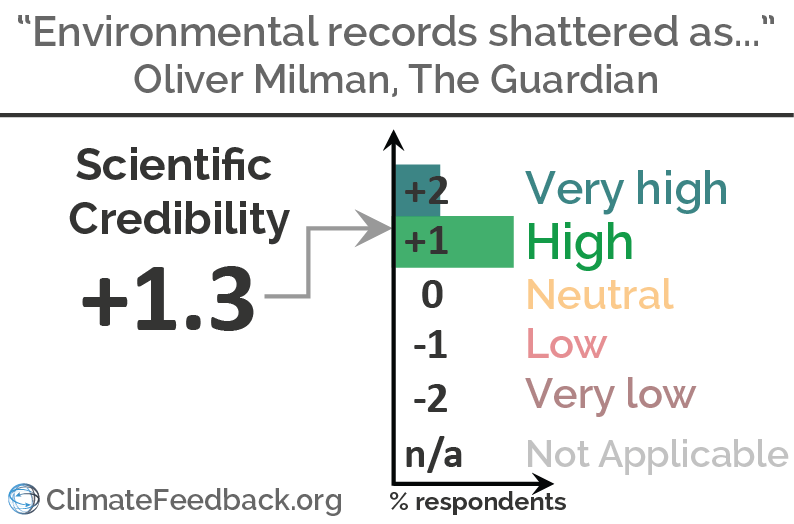
Analysis of "Environmental records shattered as climate change 'plays out before us'"
Reviewed content
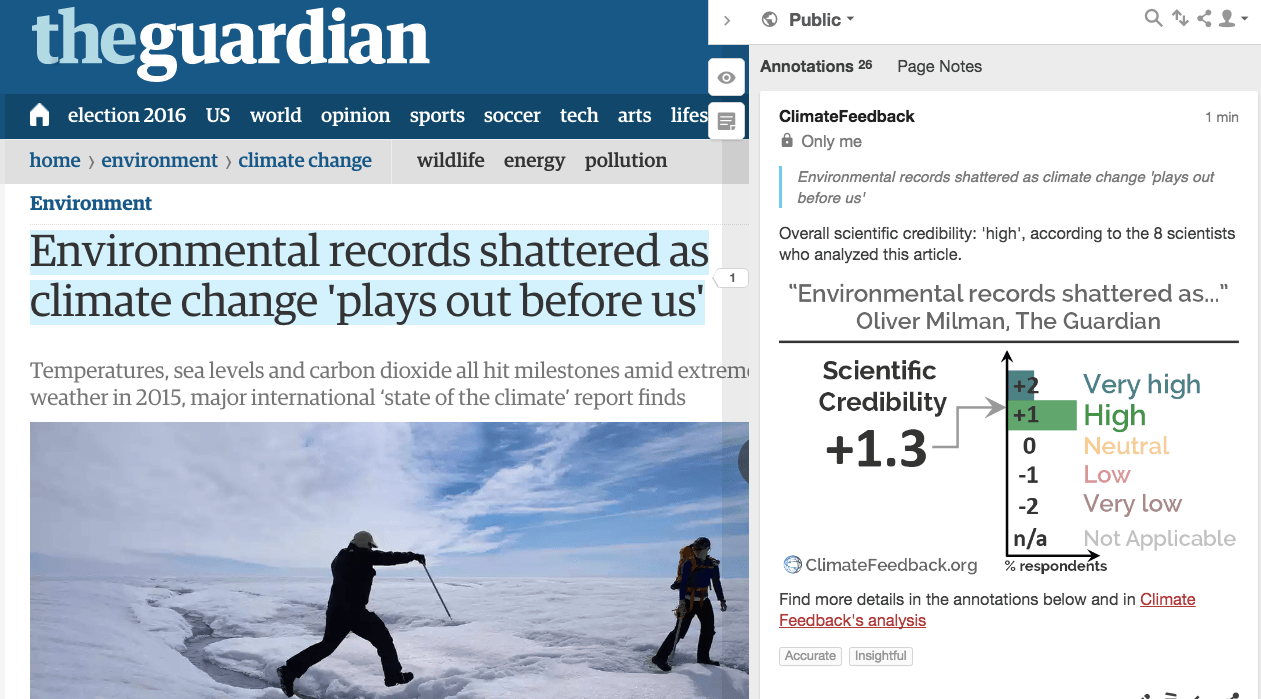
Published in The Guardian, by Oliver Milman, on 2016-08-02.
Scientists’ Feedback
SUMMARY
The article summarizes the main findings of the “2015 state of the climate” report published by the National Oceanic and Atmospheric Administration. Overall it accurately reports the main findings that many global indicators of the Earth’s climate, notably the global surface temperature, have set new records in 2015 under the joint influence of ongoing human-induced climate change and a strong El Niño event. However, scientists noted a few issues with the article, such as minor errors, a lack of background and references for some key claims and a potentially misleading attribution of Indonesian fires to climate change.
See all the scientists’ annotations in context
GUEST COMMENTS

Research Scientist, University of Colorado, Boulder
This article does a good job of summarizing results in the State of the Climate report. However, there are some areas (e.g., Greenland sea level rise contributions and extent of surface melt) where the information is not directly pertinent to modern-day effects of climate change or is presented without context. It is difficult to present so many scientific results regarding climate change in such a short article, and the author doesn’t always succeed at providing the necessary context. Nevertheless, the title clearly conveys the sum total of recent observations, which now show definite fingerprints of climate change in our annual weather.
REVIEWERS’ OVERALL FEEDBACK
These comments are the overall opinion of scientists on the article, they are substantiated by their knowledge in the field and by the content of the analysis in the annotations on the article.

Research Fellow, Nanyang Technological University
The article did a good job at summarizing the “State of the Climate 2015” report by the AMS. There were few prominent mistakes (the confusion regarding the 90+% of the total extra heat absorbed in the climate system being stored in the oceans stands out) and a few language imprecisions, but overall it conveyed the information and the main conclusions clearly.

Scientist, University of Bonn, Germany
The general reader will get a fair impression about the state of the climate in 2015, but the scientifically interested reader will also find several irritating and unnecessary mistakes in details.

Assistant Professor, University of Colorado, Boulder
The article is accurate and reflects the report. It is a little vague here and there, but useful for a general audience.
Good review of the State of the Climate report. Does appear to conflate climate change with El Niño effects, but at the same time highlights a quote regarding the dual contributions of El Niño and climate change to climate anomalies in 2015.

Senior scientist, The Norwegian Meteorological institute
The main picture provided by this report is consistent with the science, although there was a minor mistake (ocean uptake of CO2).

Professor, University of Bristol
The other commenters have admirably picked up on the slight inaccuracies in the article. I nonetheless believe that a “+2” is in order because the glitches are quite subtle (with the possible exception of confusing 90% of heat with 90% of CO2). On balance, it is very clear that the author tried to convey complex material accurately and this effort was quite successful.

Senior Scientist, Woods Hole Research Center
The string of records broken and nearly broken in 2015 is stunning, and the story continues into the first half of 2016. Clearly a strong El Niño “juiced” the already disturbed climate system, but the Earth’s behavior in 2015 and recent months may be a preview of a future when global-average warming approaches the 2-degree C level that is generally expected to bring dangerous consequences.
Notes:
[1] See the rating guidelines used for article evaluations.
[2] Each evaluation is independent. Scientists’ comments are all published at the same time.
Key Take-aways
The statements quoted below are from Oliver Milman; comments and replies are from the reviewers.
“This means that the world is now 1C warmer than it was in pre-industrial times”
Scientist, University of Bonn, Germany
The temperature is 1°C warmer than in the beginning of the instrumental temperature record (1880). The 19th century was likely a little colder than the pre-industrial period. This difference is not large and currently being studied, but likely we did not cross the 1°C warming relative to pre-industrial yet.
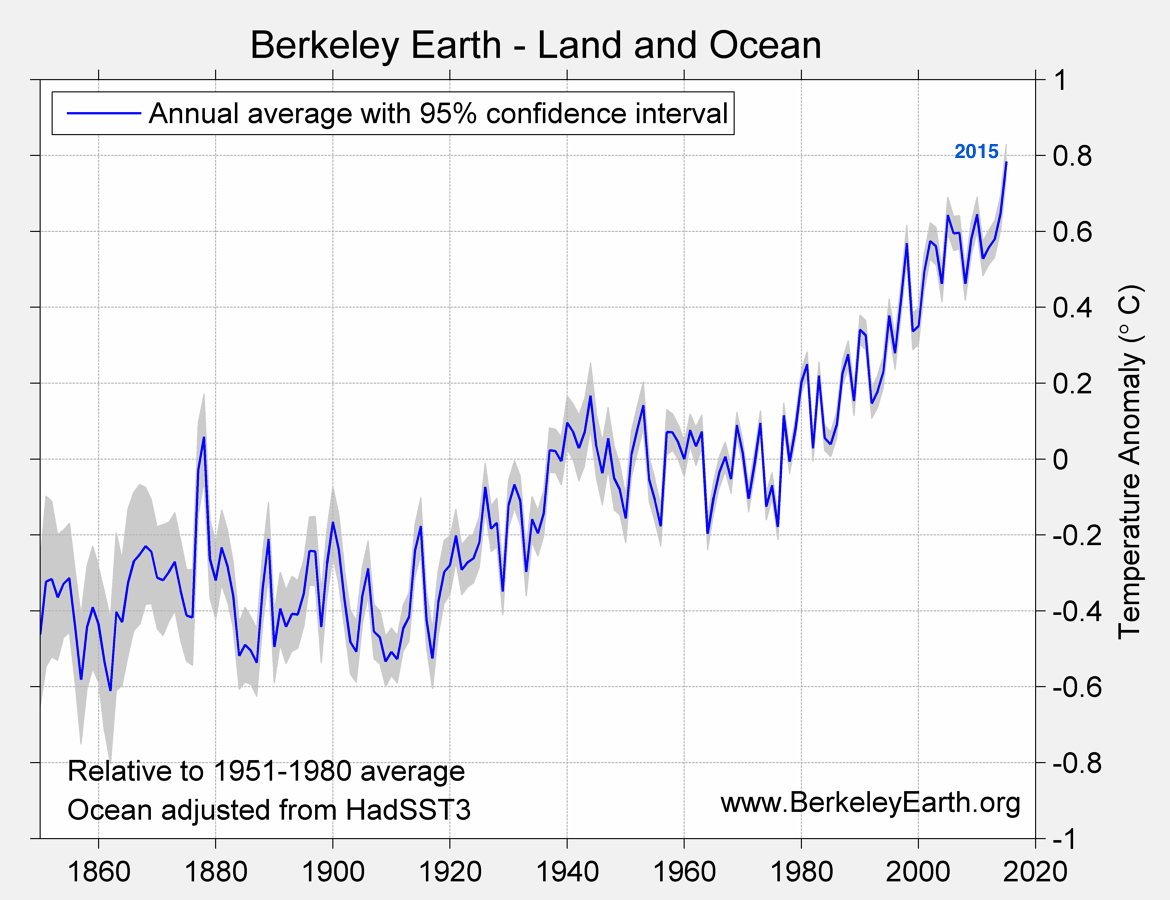
Global temperature in the Berkeley Earth dataset from 1850 to 2015
“The UN has already said that 2016 is highly likely to break the annual record again, after 14 straight months of extreme heat aided by a hefty El Niño climatic event, a weather event that typically raises temperatures around the world.“
Scientist, University of Bonn, Germany
The influence of El Niño was likely not as large as it was in 1998. A large part of the warming was also in the Arctic, as Jan Lenaerts also argues below.
Assistant Professor, University of Colorado, Boulder
I would say that it increases ‘global mean temperature’. An El Niño does not necessarily imply warming everywhere on Earth. Also, especially pronounced are the warm conditions in the Arctic, which are not explicitly mentioned here, but do not relate to the strong El Niño.
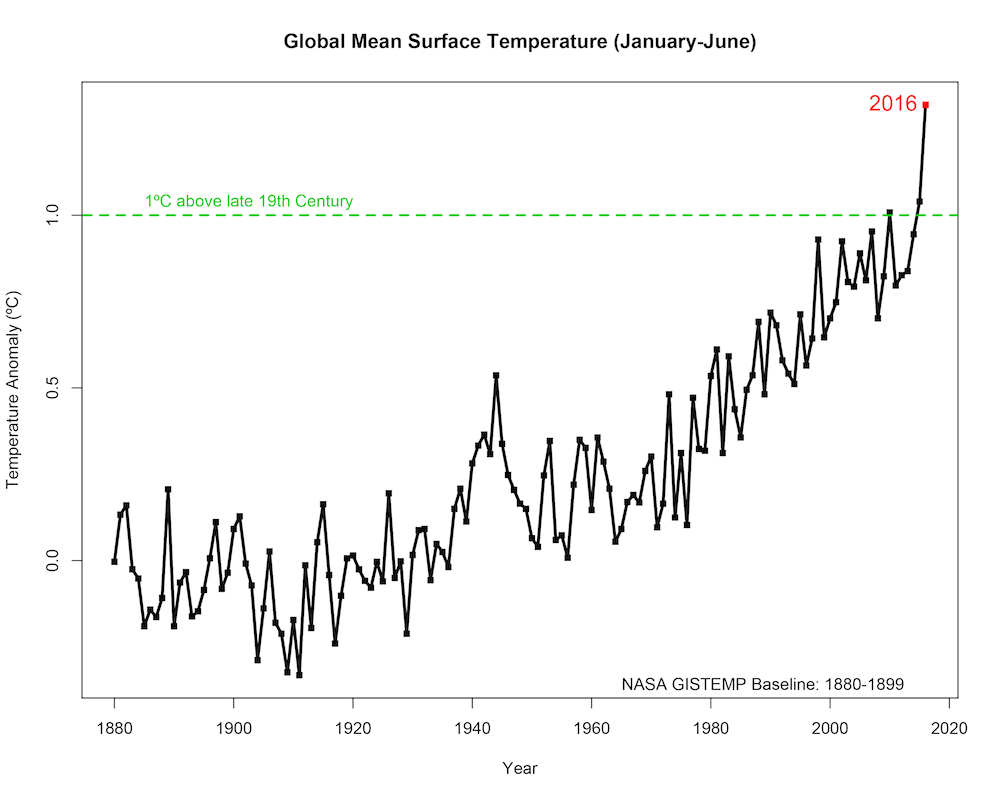
The first six months of 2016 were the warmest six-month period in NASA’s modern temperature record, which dates back to 1880. Credits: NASA/Goddard Institute for Space Studies
“The thermal expansion of the oceans, compounded by melting glaciers, resulted in the highest global sea level on record in 2015.”
Research Fellow, Nanyang Technological University
This statement in the AMS report refers to the satellite altimetry record, which reaches back to 1993. It is also important to remember that it refers to the global average sea level.
We do have local records of past sea level that extend further back in time, for instance tide gauge records or inferences based upon biological markers. For instance, combined tide gauge records have been used to infer global mean sea level rise (GMSL) over the 20th century and into the 21st century. The obtained estimate of the GMSL rise agrees with the satellite altimetry record in their overlap since 1993 (e.g., Hay et al., 2015: Probabilistic reanalysis of twentieth-century sea-level rise).
“The oceans, which absorb more than 90% of the extra CO2 pumped into the atmosphere“
Senior scientist, The Norwegian Meteorological institute
Here “CO2” should be “heat” … according to the Scripps Institute, the uptake of CO2″ is about 26%.
Research Fellow, Nanyang Technological University
“The oceans, which absorb more than 90% of the extra CO2 pumped into the atmosphere” should read “The oceans, which absorb more than 90% of the extra heat pumped into the climate system“.
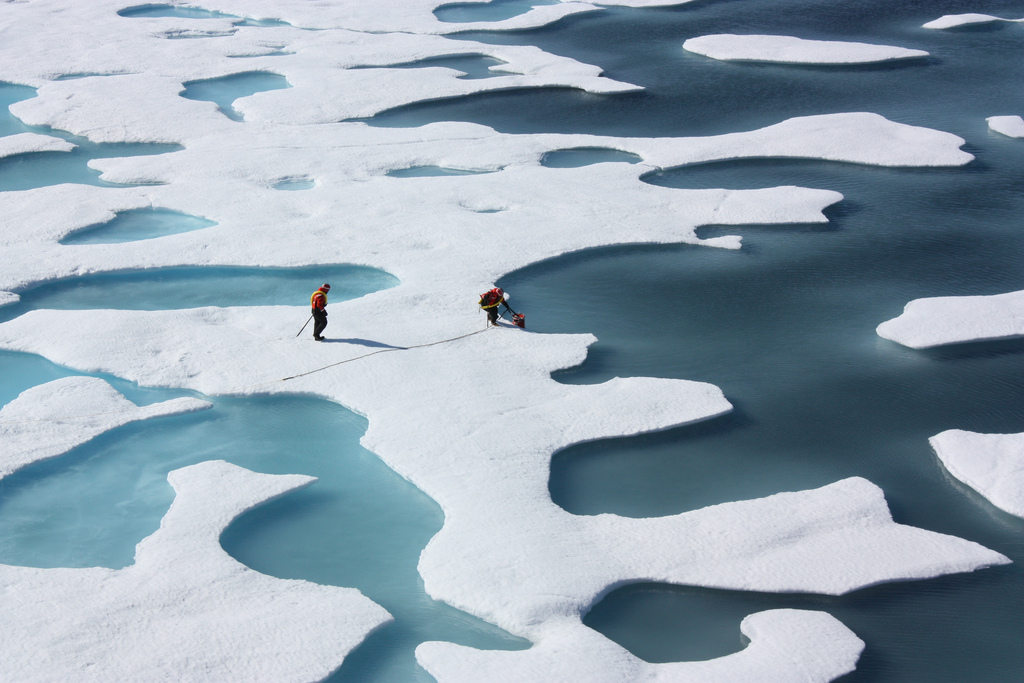
“The world’s alpine glaciers recorded a net annual loss of ice for the 36th consecutive year and the Greenland ice sheet … experienced melting over more than 50% of its surface.”
Assistant Professor, University of Colorado, Boulder
That is correct, see figure below:
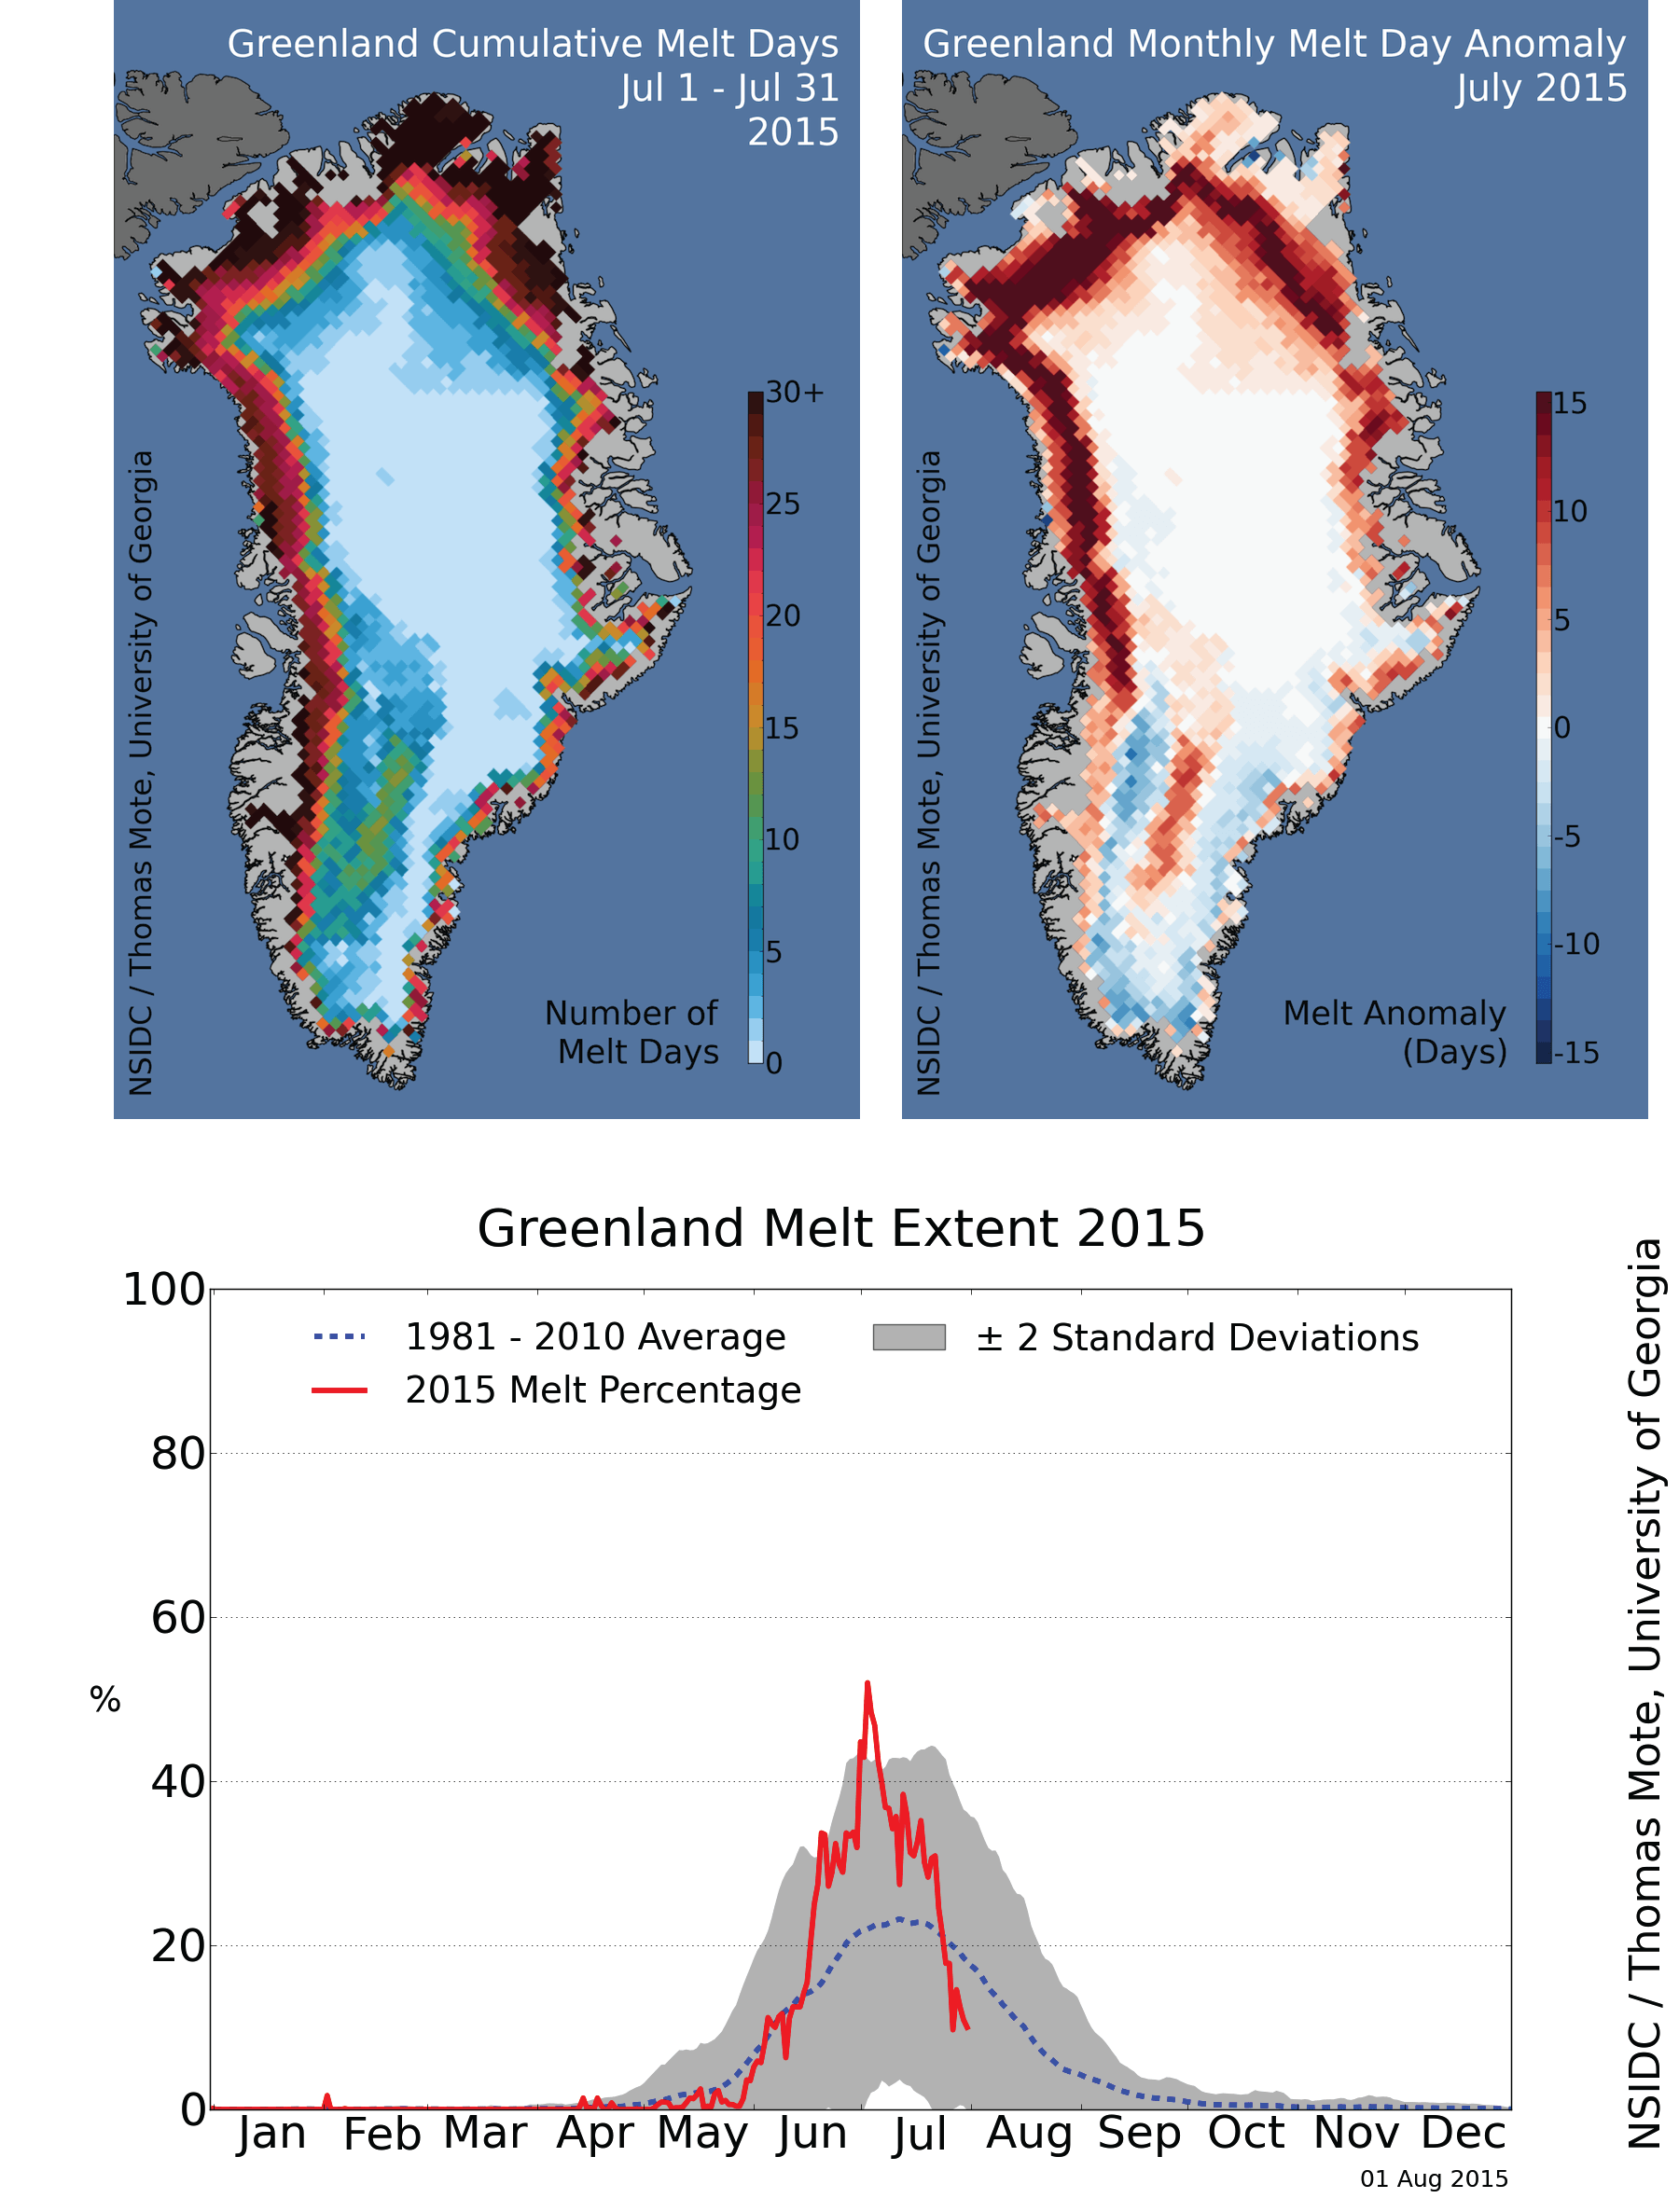
There was an event in the beginning of July when ~50% of the ice sheet experienced melt. This is clearly outside of the expected natural variability, but does not necessarily project the overall Greenland summer (since such melt events are extremely episodic). Overall, Greenland experienced a warm summer, with slightly more surface runoff than average and overall average amounts of snowfall (source)
Research Scientist, University of Colorado, Boulder
This is true. Perhaps more important, though, is that surface melt in Greenland started early this year and included several large spikes. While current surface melt is not currently larger than the record-breaking 2012 melt year, it is ahead of 2013-2015 so far. The NSIDC has an excellent summary of current melt status for Greenland here.
“Greenland ice sheet … would balloon sea levels by around 7m should it disintegrate”
Research Scientist, University of Colorado, Boulder
This is a reasonable number for the total mean sea level rise if all of the Greenland Ice Sheet melted. Total melt of the Greenland Ice Sheet, however, is essentially impossible over the next several hundred years. Nevertheless, the Greenland Ice Sheet has been losing large amounts of ice and the rate of loss has increased over the recent decade or so (references include this paper and this one). The amount of ice Greenland has lost to date has already raised global sea levels and projections indicate the possibility of 0.5 m more sea level rise from Greenland alone over the coming several centuries.
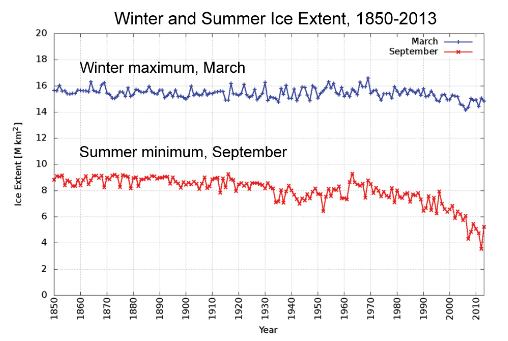
“other “remarkable” changes in 2015 include the Arctic’s lowest maximum sea ice extent in the 37-year satellite record, recorded in February 2015.”
Senior Scientist, Woods Hole Research Center
The graphs below show a best estimate of ice extent for the period 1850 to 2013 for winter and summer. Source: NSIDC
“The rapid changes in the climate may have profound consequences for humans and other species… Severe drought caused food shortages for millions of people in Ethiopia, with a lack of rainfall resulting in “intense and widespread” forest fires in Indonesia that belched out a vast quantity of greenhouse gas”
Technically correct, in that drought due to lack of rainfall is linked to Indonesian forest fires in some El Niño years.
The lead sentence for the paragraph implies a link between climate change and the following events, including Indonesian forest fires, which is not established. To the extent that climate change might be affecting the frequency and intensity of El Niño events or rainfall patterns during El Niño events, it might be playing a role, but that is not claimed in this article. For example, Dai 2012 (Increasing drought under global warming in observations and models) documents a decreasing observed precipitation trend in Indonesia, but Trenberth, Dai et al 2014 (Global warming and changes in drought) note that “it is probably not possible to determine reliable decadal and longer-term trends in drought without first accounting for the effects of ENSO and the Pacific Decadal Oscillation.” Trenberth, Dai et al also note that drought due to El Niño effects on precipitation may also be exacerbated by the effects of warming on evapotranspiration, which is an area of ongoing study.