- Climate
Breitbart misrepresents research from 58 scientific papers to falsely claim that they disprove human-caused global warming
Reviewed content
Headline: "‘Global Warming’ Is a Myth, Say 58 Scientific Papers in 2017"
Published in Breitbart, by James Delingpole, on 2017-06-06.
Scientists’ Feedback
SUMMARY
In an article for Breitbart, author James Delingpole claims to provide 58 scientific papers published in 2017 that show global warming to be “a myth”. This claim is sourced entirely from a list on a blog called “No Tricks Zone”. Delingpole claims “comfort” in “know[ing] that ‘the science’ is on our side”, but he can only do so by fundamentally misrepresenting the scientists’ research.
Climate Feedback reached out to authors of the scientific studies in the list of 58 papers that Delingpole claims “corroborate, independently and rigorously” his view that “‘man-made global warming’ just isn’t a thing.”
So far, 29 scientists have responded to our request for comment, and all 29 have replied “No” to the question, “Do you agree with the Breitbart article that your study provides evidence against modern climate change caused by human activities?” You can read more about their reactions below.
See all the scientists’ annotations in context
REVIEWERS’ OVERALL FEEDBACK
These comments are the overall opinion of scientists on the article, they are substantiated by their knowledge in the field and by the content of the analysis in the annotations on the article.

Assistant Research Professor, University of Minnesota
Despite initially getting the amount of warming the planet has experienced correct, the article goes on to trivialize this global temperature increase and proceeds to provide a 101 course in logical fallacies. This article grossly misinterprets open-access scientific papers by simply looking at graphs and entirely ignoring their meaning as explained by authors in the text.

Assistant Professor, San Jose State University
The article describes a blog post which contains a number of cherry-picked graphs that are irrelevant to the ultimate question of how much humans have contributed to global warming over the past century. It also ascribes conclusions to numerous scientists that the scientists themselves have clearly not made.

Physical Oceanographer, British Antarctic Survey
This piece is a logically flawed “straw man argument”. Delingpole claims to have disproven human-driven climate change, but he does not engage with how climate change actually works.
Human-driven climate change is primarily about the effects of carbon dioxide on the entire climate system. When more carbon dioxide is added to the atmosphere via fossil fuel burning, more energy ultimately reaches Earth’s surface. This extra energy ends up in the ocean, atmosphere, and cryosphere (i.e., sea ice and land ice).
To see the clearest fingerprints of the extra energy added to the climate system from fossil fuel burning, you have to look at the energy content of the entire climate system over the last several decades (most of the extra energy has gone into the ocean [Levitus et al. 2012]*). Trying to disprove global warming in recent decades using regional, seasonal, atmosphere-only temperature trends on centuries-long timescales is very misleading.
- Levitus et al (2012) World ocean heat content and thermosteric sea level change (0–2000 m), 1955–2010 Geophysical Research Letters
Notes:
[1] See the rating guidelines used for article evaluations.
[2] Each evaluation is independent. Scientists’ comments are all published at the same time.
Reviewers’ Comments
The statements quoted below are from the Breitbart article; comments and replies are from the reviewers.
“Late 20th century and early 21st century global warming, they show, is neither dramatic, nor unusual, nor scary. Here … are just some of the charts to prove it.”

Professor, McGill University
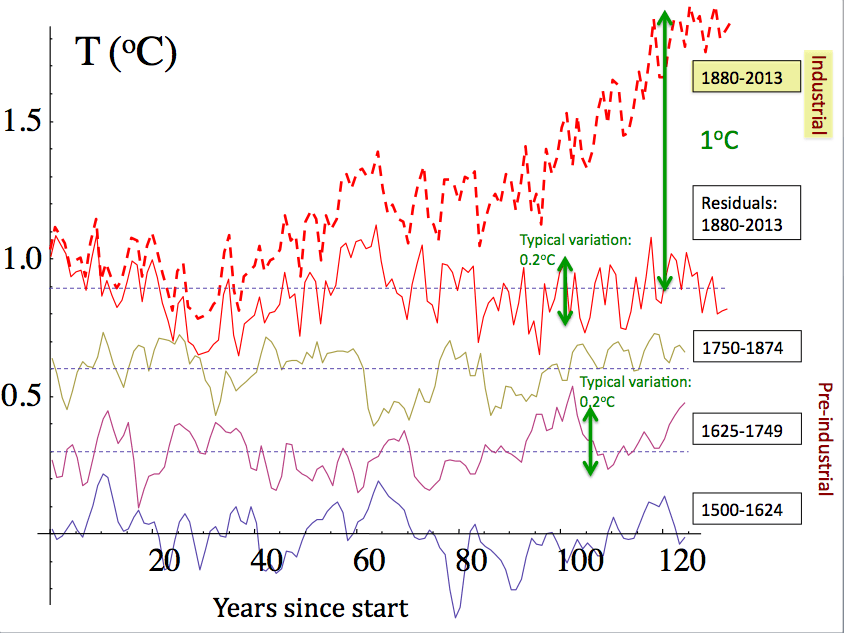
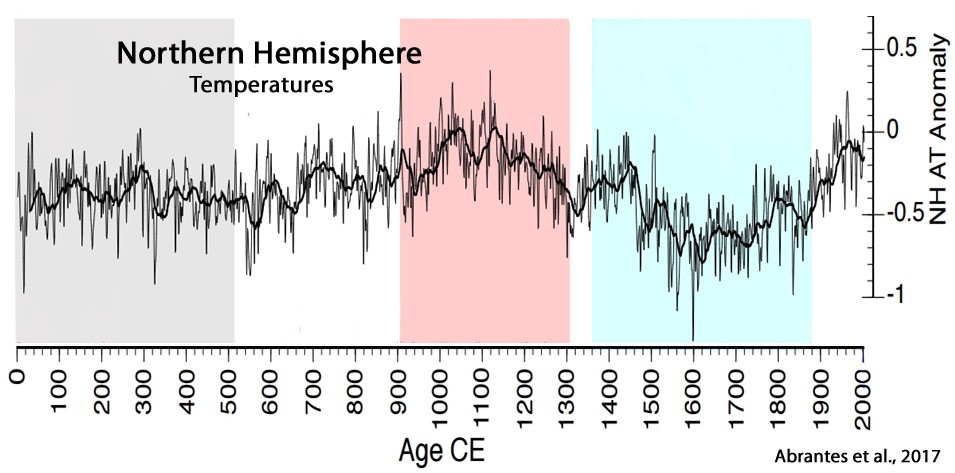
The four charts presented in the Breitbart article purport to demonstrate that the industrial epoch warming is simply a giant natural fluctuation. But it shows nothing of the sort; it is based on a complete misunderstanding of the space-time variability of the atmosphere. The article commits two common, but fundamental errors that totally invalidate its claims.
The first two charts are both of spatially global scale (the northern hemisphere), they illustrate the time scale error. They show northern hemisphere temperatures with millennial scale fluctuations (changes) of the order of 1°C; the so-called “medieval warming event”. Irrespective of whether these reconstructions are accurate (the global—not European—extent of the warming is the question under debate), the change occurred over time scales much longer than the 1°C warming that occurred over the last century. In the pre-industrial period, typical century long, global scale temperature fluctuations were about 0.2°C (i.e. typical century to century changes, see figure below); therefore if the temperature fluctuations followed the usual “bell-curve”, then a 1°C change in a century would have a probability of about one in 3 million of occurring naturally, the giant natural fluctuation hypothesis could easily be rejected. However, it was found that the bell curve under estimates the extreme 3% of the temperature fluctuations: extreme “black swan” events occur much more frequently than expected, yet, even when these rare extremes are taken into account, the probability of a 1°C change in a century is still less than 0.1%, it can easily be rejected1.
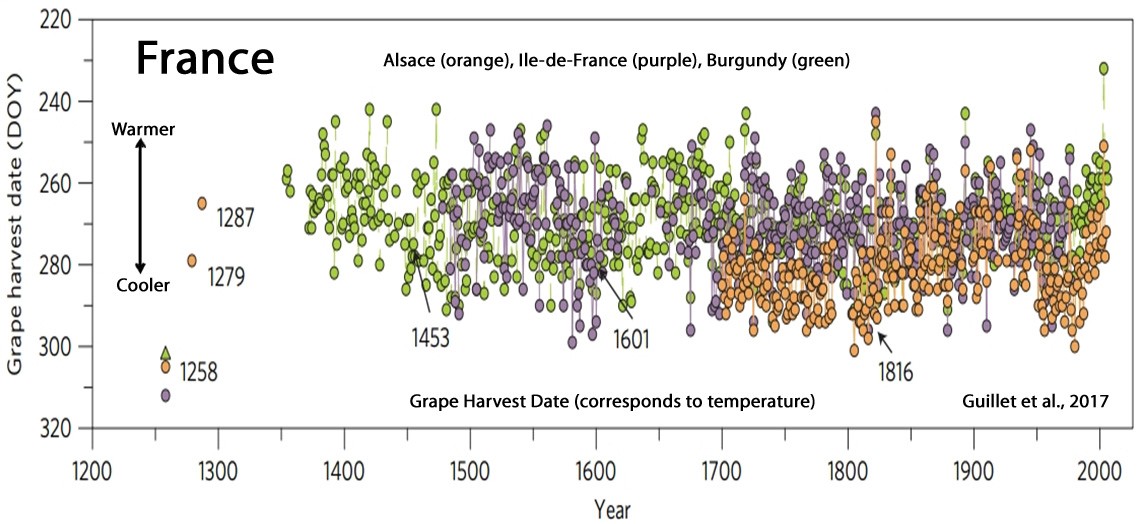
The other fundamental error is also a scale error, but now in space rather than in time. This error is well exemplified in the fourth graph which shows data indirectly reflecting temperatures in France. Yet France is only about 0.1% of the global surface area, so that large natural fluctuations are common but are not of global significance. A common “skeptic” talking point is the fact that between 1662 and 1762, the temperature in central England increased by nearly 1 °C, i.e., about the same as the global temperature over the last century. Unfortunately for the “skeptics”, central England (greater London) is about 0.01% of the earth’s surface area so that it is not surprising that over the same period, the Northern Hemisphere temperature only increased by 0.2 °C (equal to the typical centennial change!).
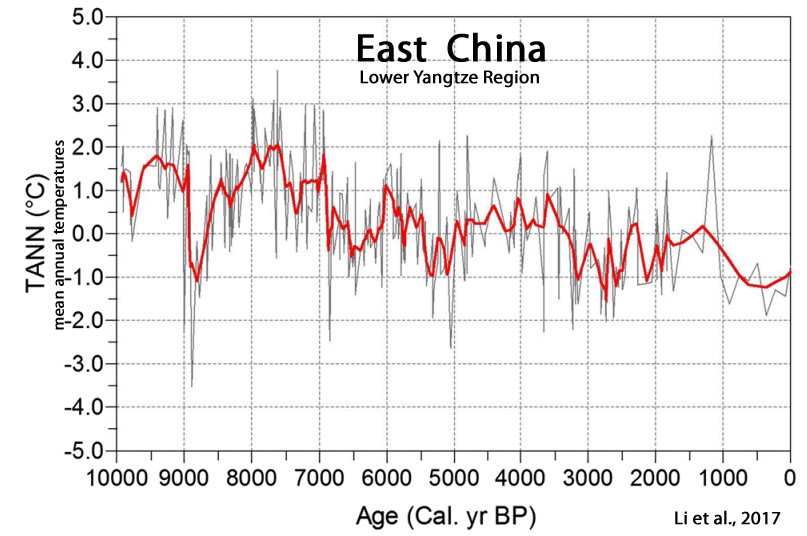
Finally, the third graph from China combines the two errors: the times scales are way too long and the spatial scales are way too small; it is doubly irrelevant to the question of anthropogenic global warming.
Source Lovejoy (2014)
- 1- Lovejoy (2014) Scaling fluctuation analysis and statistical hypothesis testing of anthropogenic warming. Climate Dynamics
“Here’s an unusual one from Guillet et al suggesting that there’s nothing new about wildly early or late grape harvests through the centuries

Associate Research Scientist, Columbia University
The Guillet et al paper primarily uses wine grapes to look at the impact of the 1257 Samalas eruption (volcanic aerosols cool the climate, delaying grape maturation and harvest). I haven’t read the paper in the detail, but as far as I can tell they do not make any claims about recent warming or harvest trends.
Contrary to the claim quoted above, our own work suggest that warming has significantly advanced wine grape harvests over western Europe1.
We found, on average, that winegrape harvests have been occurring significantly earlier since 1980 (on average 10 days earlier than the 1600-1900 average). In fact, 2003 was the earliest harvest in the record by about a month.
On a broader note, I want to point out that exceptional events in the paleoclimate record do not undermine the case for attributing recent warming to anthropogenic greenhouse gas emissions. We know there have been warm periods in the past, but we have quite a bit of significant independent evidence that recent warming can only be explained by invoking anthropogenic activities.
[read the Dr Guillet’s comment below]
- 1- Cook & Wolkovich (2016) Climate change decouples drought from early wine grape harvests in France. Nature Climate Change
“the mild warming of around 0.8 degrees Celsius that the planet has experienced since the middle of the 19th century”
Assistant Research Professor, University of Minnesota
This figure [0.8°C] is generally accurate. Global average air temperature has increased by just under 1.0ºC, according to NASA Goddard Institute for Space Studies and confirmed by numerous other organizations:
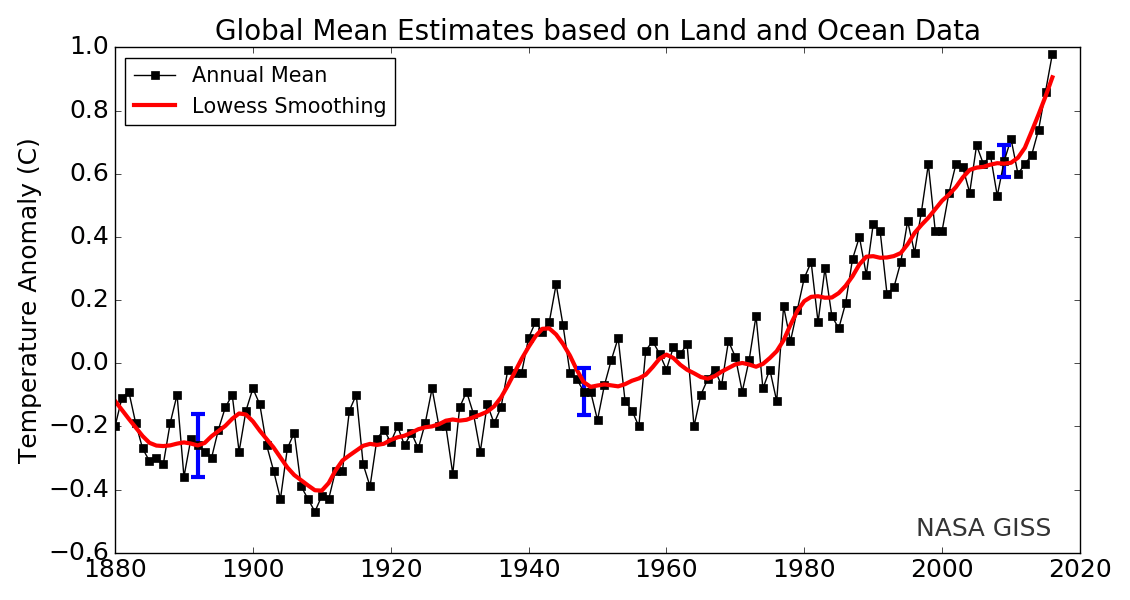
Source: NASA GISS
However, it is quite disingenuous to suggest that warming the entire atmosphere by this amount is “mild.”
Yes, it is a relatively mild adjustment on your home thermostat, increasing the temperature by less than one degree. For Americans, if your home is heated to 65ºF and you increase the temperature by 1ºF, that is equivalent to about a 0.6ºC increase. Heating the amount of air in your home is quite a different matter than heating the entire atmosphere. Just to start, the atmosphere has an approximate mass of 5 x 10^18 kg—that’s 5 quintillion kg or 11 quintillion pounds. In just over 100 years or so, we’ve increased the global air temperature thermostat by a staggering 0.8ºC—and we’re still emitting the greenhouse gases responsible for the warming.
“Several of the papers note that the primary influence on warming appears to be solar activity. Few, if any, entertain the notion that carbon dioxide levels have much to do with it.”
Assistant Professor, San Jose State University
Many of these papers discuss the causes of temperature changes over the past several centuries or millennia. Indeed, solar activity is thought to be one of the primary drivers of the observed temperature variability over this these longer time periods. This is not the case over the past several decades. Over this recent time period we know that the Sun’s intensity has not gotten stronger because we are measuring it with satellites and we know that increasing greenhouse gasses are causing warming. We know that increasing greenhouse gasses are causing warming due to fundamental physical laws—not simply from observing that temperatures and greenhouse gas levels happen to be rising at the same time.
“collaborating on studies which all corroborate, independently and rigorously, the increasingly respectable view that ‘man-made global warming’ just isn’t a thing.”
Assistant Professor, San Jose State University
These studies do not make this claim. Most of them are about regional (not global) temperature variations of the distant past. They generally make no claims regarding the causes of global warming over the most recent several decades nor do they make any claims about the amount of warming expected as we continue to increase greenhouse gas concentrations.
Assistant Research Professor, University of Minnesota
This false statement is based on a list of figures taken completely out of context. For instance, No Tricks Zone [the blog Breitbart is using as a source] takes a figure from Markle et al., (2017)1 and assumes the x-axis refers to years before present. With this incorrect interpretation, it seems as though ocean temperature anomalies are very low at year 0. However, these plots show the result of simulations of idealized Dansgaard-Oeschger or Antarctic Isotope Maximum events in a general circulation model. Year 0 is simply the beginning of the simulated event and is not displaying actual modern sea surface temperature data (i.e. year 0 is not today, 0 years before present).
Not only is this a red herring, it is a completely misinterpreted red herring.
They also repeat the favorite Antarctic cooling cherry, taking (and altering) a figure from Mayewski et al., (2017)2 which shows Antarctic-wide climate reanalysis temperature data. As a continent (larger than the US lower-48), Antarctica is not warming. This is because much of high, dry East Antarctica is not warming. However, important areas of Antarctica, including West Antarctica which likely would show about a 0.2ºC per decade warming trend over the reanalysis period (from 1979 to present, since satellites have given good data coverage). Climate is incredibly variable around Antarctica, and also through time (large interannual variability). This is well studied, but if you only look at one graph rather than reading the research papers you will not be aware of this.
See:
- Nicolas and Bromwich (2014) New Reconstruction of Antarctic Near-Surface Temperatures: Multidecadal Trends and Reliability of Global Reanalyses. Journal of Climate
- Bromwich et al (2012) Central West Antarctica among the most rapidly warming regions on Earth. Nature Geoscience
- 1- Markle et al., (2017) Global atmospheric teleconnections during Dansgaard–Oeschger events. Nature Geoscience
- 2- Mayewski et al., (2017) Ice core and climate reanalysis analogs to predict Antarctic and Southern Hemisphere climate changes. Quaternary Science Reviews
Response From The Authors Of The “58 Studies”
Tyler Jones, Research Associate, University of Colorado
The West Antarctica temperature plot that was pulled from my 2017 paper is very low resolution, and does not resolve the most recent few 100 yrs. We know from other studies that West Antarctica is currently warming faster than almost any other place on Earth. Furthermore, my paper has nothing to do with global warming or human activities. In fact, I only focus on time periods well before the Industrial Revolution. It is clear that global warming is caused predominantly by human activity.
Belinda Dechnik, The University of Sydney
My data does discuss sea surface temperature in the Great Barrier Reef being slightly warmer than present during the mid-Holocene in response to natural climate variability. However, I in no way deny that the current climate is warming, and that anthropogenic effects are proving very detrimental, particularly to reef systems. This article has misunderstood my findings and in no way supports my view on climate change. I am very disturbed indeed that these people have used my article in such a way to try and discredit the serious effects of man-made climate change.
Nathan Steiger, Postdoctoral Fellow, Columbia University
The blog post maliciously tampered with figures from my paper, removing lines from the figures. My paper is just not relevant to the arguments about global warming.
R. Scott Anderson, Professor, Northern Arizona University
Although the curve shown in the Breitbart article supports our research, the specific curve cited is not our work, but comes instead from nearby tree-ring research done by Greg Wiles and his co-workers (2014). This is clearly stated in the figure caption in our article, which could have been seen if the article had been actually read. My conclusion from this is that Breitbart was not careful in its compilation, and for me this calls into question their methods for collecting data on other articles. Our conclusions are much more complex, and suggest that post-Little Ice Age warming has occurred, and has affected forests at higher elevations to a greater extent than at lower elevations.
Yair Rosenthal, Professor, Rutgers University
The data were taken out of context. In fact a previous article (Rosenthal et al., 20013) made the argument that the current warming, as measured by the increase in Ocean Heat Content (OHC), is a reversal of the long-term cooling trend in the preceding centuries and the rate of heat gain is substantially higher than recorded in the past. If anything, these data support global warming as manifested by the recent increase in OHC.
Normunds Stivrins, Associate Professor, University of Helsinki
Our article (Stivrins et al., 2017, The Holocene) focuses on other subjects than human-induced impacts (climate change). It’s sad that the blogger did not understand what this study is about, but rather took a sentence without context. Our point was that geological aspects can protect glacial ice in the ground but it starts to melt when air temperature increases—in this case when temperature started to increase above today’s temperatures. Note that this is a specific case study where exceptional environmental conditions prevail 8,400-7,400 years ago in western Latvia.
Bradley Markle, PhD Candidate, University of Washington
My study, and almost all I saw mentioned in the blog post, are studies of climate change in the past. My study investigates connections between different parts of the climate system during climate events that happened over 10,000 years ago. Studying climate change in the past can give context to recent climate changes. However, my study in no way investigates or tries to attribute the causes of recent climate change. It does not deal with human influences on climate.
I do not argue that “global warming… is a fake artefact [sic]”. The overwhelming scientific evidence is that the climate is currently changing and that human influences, primarily releasing CO2 into the atmosphere, have a significant impact. Though, again, this is not at all addressed in my study, nor any of the ones quoted that I recognized (though I did not read them all).
The blog post and Breitbart article are both misleading and inaccurate, on several levels.
Ernesto Tejedor Vargas, University of Zaragoza
The article Tejedor et al., 2017 is not a climate-change-denying paper. It is a paleoclimate paper showing, first, a new maximum temperature reconstruction for the last 400 years (including the current warming) and second, a new standardization method in dendrochronology to remove the non-climatic trend.
The image in the post does not by any means reflect the message of the paper. That figure is the raw temperature of the CRU dataset in the region, i.e., [I would like the author of the No Tricks Zone post to] remove my name from the blog since it is not reflecting our research conclusion.
David Reynolds, Postdoctoral Research Associate, Cardiff University (and co-authors)
The article uses Figure 11 from Reynolds et al., 2017 without displaying the figure caption. The caption for this figure clearly states that the data shown have been detrended using a simple linear function in order to highlight the high-frequency (sub-centennial) mean annual sea surface temperature (SST) anomalies. This means we have statistically removed the long-term trend, i.e., the 20th century warming signal. The long-term trend was removed from the observational SST data as the particular proxy data being used for comparison, the marine bivalve growth increment width (GIW), does not record the low frequency change, such as the long-term warming trend. The reason the GIW chronology doesn’t record the long-term trend is because there are changes in the growth rates of the bivalves as they age (older=slower=thinner GIW). The standard procedure (e.g. Butler et al., 2009) for taking these so-called “ontogenetic effects” into account removes the ability of the GIW proxy to record long-term trends while retaining the signal of high-frequency variability. Looking at the non-detrended observational SST data (Fig 1) clearly shows there is a long-term warming trend over the 20th century in northeast Atlantic sea surface temperatures.
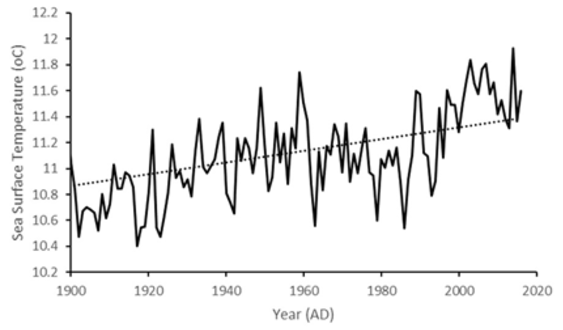
Fig 1 — The black line shows mean annual sea surface temperatures over the North East Atlantic (50-60oN by 10-0oW). The dashed black line shows the linear trend over the 20th century. The data shown here are the raw data that were then linear detrended for use in Reynolds et al., 2017 Fig 11.
- Butler et al., (2009) Marine climate in the Irish Sea: analysis of a 489-year marine master chronology derived from growth increments in the shell of the clam Arctica islandica. Quaternary Science Reviews
Ulrich Kotthoff, Scientist, University of Hamburg
Our project covers the past ~8,000 years. The pollen-based climate reconstructions shown in our article include only two samples that cover the past 200 years. The temporal resolution of our study is thus not suited to reveal human influence on climate since the industrial revolution.
Ironically, it might even be that the upper pollen samples are biased by human activity, meaning that human influence on vegetation in our research region (Southern Baltic region) might have hampered the reconstructions, e.g. by deforestation.
Last not least, our data shows as well that winter temperatures did strongly increase over the past 4,000 years. One of our proxies indicates a strong temperature increase in the marine realm for the youngest sample. Interestingly, these data are not shown in the Breitbart article. Why?
Our discussion of the validity of the different reconstruction methods and our interpretation of the climate signals is not taken into account at all.
Matthias Thienemann, PhD Candidate, University of Cologne
I do not agree with the Breitbart article that my study provides evidence against modern climate change caused by human activities. My paper deals with climate and environmental change on a larger timescale and does not allow any conclusions about current global warming.
Aurel Persoiu, Emil Racovita Institute of Speleology
We do not provide evidence against modern climate change caused by human activities because our record stops at AD 1860±20. Ice younger than this age has melted in the past decades:
“Historical observations have shown that between AD 1863 and 1982, enhanced melting and related changes in the geometry of the ice block led to the loss of ~100 cm of ice. Based on annual ice accumulation rates derived independently of the current one (between 0.9 and 1.6 cm/year, with a mean value of ~1.3 cm/yr), we estimated an age of AD 1860 ± 20 (similar to 90 cal BP) for the top of the ice core.”
The chart featured in the quoted blog article is showing the North Atlantic subtropical sea surface February temperature reconstruction of deMonecal et al (Science, 2000), not our reconstruction. We have used the deMonecal et al data in our figure 3 (panel d) and our reconstruction is in the same figure, panels c (temperature) and g (moisture source). The error in the blog article is clearly visible in the figure, where the label on the left axis reads “Atlantic winter SST”, whereas the figure itself is labeled “East central Europe”. Incidentally, the deMonecal et al data stops at 88 cal BP (similar to AD 1862).
Henning Åkesson, Research Fellow, University of Bergen
The Breitbart article uses a classic and flawed argument with respect to my paper, namely that “since it was warmer before (cherry-picking Norway in the mid-Holocene, around 6000 years ago), the warming we’re seeing now must be a natural phenomenon”. To infer that humans can’t be behind recent climate warming because climate changed before humans is flawed reasoning.
My paper does not concern the causes of climate change, nor does the particular statement referred to in my paper (which is actually itself referring to previously published studies) provide evidence against modern climate caused by human activities. Climate in the mid-Holocene was warming due to a different configuration of Earth’s orbit relative to the sun, while warming of the last decades has been shown by overwhelming evidence (>95 % confidence in latest IPCC report) to be caused by human activities.
Fatima Abrantes, Portuguese Institute for Sea and Atmosphere
As anyone well informed certainly knows, an average climate warming does not at all mean that every region in the world will warm at the same rate. In fact the impact of such warmth on the atmosphere and in the surface ocean waters causes changes in the atmospheric and oceanic circulation which will have different impacts on different regions. The article on Breibart.com is so bad that the author did not even realize that the figure extracted from my paper is not my new data record but the record of the northern Spain atmospheric temperature anomaly, produced by Martín-Chivelet et al., (2011) that I have used for comparison. Indeed, my paper proves that while in the NW Iberian margin Sea Surface Temperatures (SST) during the 20th century were similar to the Medieval Warm Period ones, in the Algarve region SST shows a general increase of about 2 ºC in the last 50 years. Such results agree with both the global and regional projections that indicate this region of Europe with highest potential vulnerability in regard to current global warming (Climate, 2011).
- Martín-Chivelet, et al (2011) Land surface temperature changes in Northern Iberia since 4000 yr BP, based on δ13C of speleothems, Global and Planetary Change
Branwen Williams, Assistant Professor, Claremont McKenna College, Pitzer College, Scripps College
The seawater temperature data clearly show an increase of ~0.8C since 1860. While there are fluctuations in temperature of similar scale preceding that, the drivers of these fluctuations differ.
Feng Sheng Hu, Professor, University of Illinois
The graph they claimed was evidence from my article in fact was NOT even a result of [ours]. It’s a graph in an article we cited.
Rob Wilson, University of St. Andrews
Many of the papers are local/regional studies and will not be representative of large scale trends. One also needs to fully understand the uncertainties of these records.
The latest attempts of tree-ring based northern hemisphere reconstructions clearly show a warming signal in the recent period. The constituent records may have more local complexity, but this gets averaged out/minimised when combined for large scale analyses*.
A good example of what I mean at the local scale is the mention of the Rydval 2017 Scottish work. Rydval was my PhD student. The warming of Scottish summer temperatures are significant within the context of the post 1550 period. Our paper clearly states that there is great uncertainty due to less trees before this.
This article does not take into account local scale variability and large scale forcing, the signal of which we see when multiple local scale records are averaged together.
- Stoffel et al (2015) Estimates of volcanic-induced cooling in the Northern Hemisphere over the past 1,500 years Nature Geoscience
- Wilson et al (2016) Last millennium northern hemisphere summer temperatures from tree rings: Part I: The long term context Quaternary Science Reviews
- Anchukaitis et al (2017) Last millennium Northern Hemisphere summer temperatures from tree rings: Part II, spatially resolved reconstructions Quaternary Science Reviews
Sébastien Guillet, University of Geneva
First of all, it is important to state that the Guillet et al. paper, published in 2017 in Nature Geoscience, never claimed nor concluded that human-induced global warming was a “myth”. The paper merely aimed at reassessing the climatic impacts of the 1257 Samalas eruption on Northern Hemisphere climate using historical archives and tree-ring records. In other words, this study was not designed to answer the question of whether or not the recent warming is historically unprecedented.
Let us now have a closer look at the grape harvest date (GHD) plot shown in the Breitbart article written by James Delingpole. The plot is composed of 3 GHD series. The Ile-de-France (IDF) series (purple) spans the period 1478-1977 (with several gaps due to missing observations). The IDF record was published originally by Daux et al. (2012) and Guillet et al. (2017) added a GHD for the year 1258. No GHDs are currently available for the period 1977-2017 and for the Medieval Climate Anomaly (MCA) (ca. 850-1300). Therefore the incompleteness of the IDF record is certainly not suitable for any whatsoever conclusion on whether the past few decades were unusual with respect to other periods such as the MCA. Similar statements can be made for the Alsace (orange) and Burgundy (green) records which cover the period 1700-2005 and 1354-2006 (with several missing values) respectively.
We want to stress once again that GHD records shown in Guillet et al. (2017) were solely used to demonstrate that very late harvests occurred in 1258, probably as a result of the climatic anomalies (cold conditions) induced by the 1257 Samalas eruption.
GHD records are now recognized as an important regional proxy for spring-summer temperature (Chuine et al., 2004; Meier et Pfister, 2007; Maurer et al., 2009; Garnier et al., 2011). Yet, as with any other proxy, the use of this archive for climate reconstructions comes with limitations and uncertainties. Several researchers have indeed shown that spring-summer temperatures are not the only factor influencing and/or determining grape harvest (Guerreau 1995, Rutishauser et al., 2007, García de Cortázar-Atauri et al., 2010). Changes in agricultural practices, the use of different grape varieties in the same region over time, as well as the political background (e.g. military conflicts, see Garnier et al., 2011) can influence harvest dates and bias the climate signal and therefore the climatic trends contained within the GHD series (García de Cortázar-Atauri et al., 2010).
In summary, and given the limitations listed above, extreme caution must be taken before using the French GHD records to claim that global warming is a “massive lie”. We feel that additional studies addressing the limitations of this proxy and filling the numerous gaps existing in the available French GHD series must be carried out before drawing any definitive conclusion.
References:
- Chuine et al (2004), Historical phenology: Grape ripening as a past climate indicator, Nature.
- Daux et al (2012), An open-access database of grape harvest dates for climate research: data description and quality assessment, Clim. Past.
- Garcia de Cortazar-Atauri et al (2010), Climate reconstructions from grape harvest dates: Methodology and uncertainties, The Holocene.
- Garnier et al (2011), Grapevine harvest dates in Besançon (France) between 1525 and 1847: Social outcomes or climatic evidence?, Clim. Change.
- Guerreau (1995), Climat et vendanges (XIVe-XIXe siècles) : révisions et compléments, Hist. Mes.
- Guillet et al (2017), Climate response to the Samalas volcanic eruption in 1257 revealed by proxy records, Nat. Geosci.
- Maurer et al (2009), BACCHUS temperature reconstruction for the period 16th to 18th centuries from Viennese and Klosterneuburg grape harvest dates, J. Geophys. Res.
- Meier et al (2007), Grape harvest dates as a proxy for Swiss April to August temperature reconstructions back to AD 1480, Geophys. Res. Lett.
- Rutishauser et al (2007), A phenology-based reconstruction of interannual changes in past spring seasons, J. Geophys. Res. Biogeosciences
Julie Richey and Jennifer Flannery, United States Geological Survey
The Breitbart article, and the source it draws from, do not accurately reflect the subject matter or conclusions of our peer-reviewed, published research. Our paper, “Multi-species coral Sr/Ca-based sea-surface temperature reconstruction using Orbicella faveolata and Siderastrea siderea from the Florida Straits,” does not address global warming or its causes directly, and therefore does not, as the Breitbart article claims, “argue that the alarmist version of global warming — aka Catastrophic Anthropogenic Global Warming (CAGW) — is a fake artifact.”
Our paper presents a 280-year sea surface temperature record based on the ratio of strontium to calcium in corals we sampled in the Dry Tortugas National Park. It shows that sea surface temperatures measured over many decades in the Florida Straits are variable, and that variation has been dominated for nearly the past three centuries by a natural oscillation called the Atlantic Multidecadal Oscillation. We do observe a 0.8 ºC warming trend in our record from 1970-2010 (section 3.3, page 105 of Flannery et al., 2017). Neither of these findings refutes the role of anthropogenic activity in global climate change. Anthropogenic climate change is characterized by variable climate responses across the globe. No climate record taken at a single point in space is representative of the global climate.
Barbara Stenni, Associate Professor, Ca’ Foscari University of Venice
Our work agrees perfectly with the results from climate models, which show that Antarctic warming should be significantly delayed relative to the rest of the planet. Furthermore, our work confirms previous work demonstrating that West Antarctica and the Antarctic Peninsula are among the fastest-warming regions on the planet.
Andrea D. Tegzes and Eystein Jansen, University of Bergen
Firstly, about the graphs:
This is the work of Thornalley and co-authors from 2009. The datasets are based on samples from a site just south of Iceland in the northern North Atlantic (denoted by RAPiD-12-1K in Fig. 1), and not on samples from the eastern Norwegian Sea. The two graphs show reconstructed late-spring/early-summer near-surface (0-50m water depth) and sub-thermocline (approx. 100-200m water depth) ocean temperatures at this specific site. Upper-ocean temperatures at this location are particularly sensitive to changes in ocean-circulation patterns, primarily to the northeast extent of the Subpolar Gyre (SPG), and hence the degree of mixing between colder subpolar waters and warmer Atlantic waters (North Atlantic Current, NAC) (Fig. 1). The impact of ocean circulation is more pronounced at sub-thermocline depths. Near the surface, these changes are masked in part by seasonal warming.
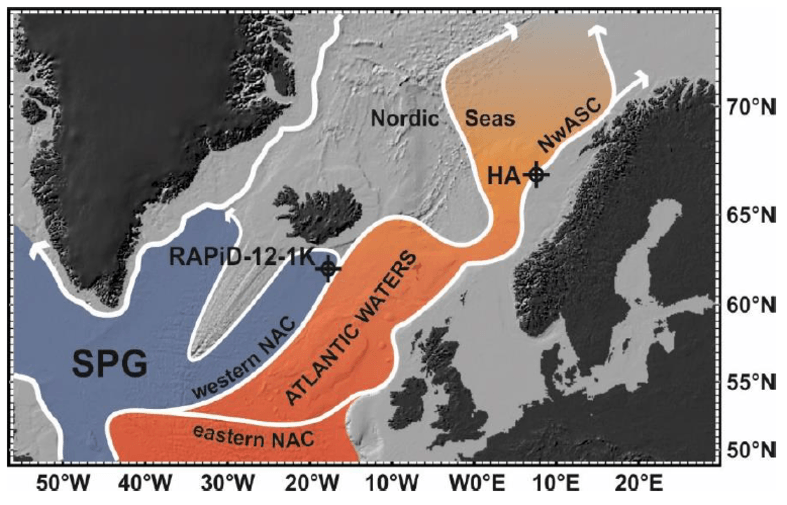
Figure 1 — The impact of changes in ocean-circulation patterns on upper-ocean temperatures south of Iceland and along the mid-Norwegian Margin. Ocean currents are marked by white arrows. Cold and warm water masses are indicated by blue and red-orange shading, respectively. Thornalley et al. (2009) used samples from the South Iceland Rise (site marked by RAPiD-12-1K), while Tegzes et al. (2017) used samples from the mid-Norwegian Margin (site marked by HA).
Secondly, about the quote in the blog post (“Our sortable-silt time series show prominent multi-decadal to multi-centennial variability, but no clear long-term trend over the past 4200 years.”):
Tegzes et al. (2017) investigated northward oceanic heat transport along the mid-Norwegian Margin, which is determined both by the temperature and volume of water advected northwards in the Norwegian Atlantic Slope Current (NwASC). We cannot directly reconstruct volume transport. However, by analyzing the coarseness of current-sorted deposits, we can make inferences about past variations in current speed. The sortable-silt time series, mentioned in the quote, are our current-strength proxy records from the mid-Norwegian Margin (site denoted by HA in Fig. 1).
When we compared these time series with upper-ocean temperature proxy records from the same location (Andersson et al., 2003; Risebrobakken et al., 2011; Risebrobakken et al., 2003), we found either no correlation or, a seemingly counterintuitive, inverse relationship between the strength of the NwASC and the temperatures of the upper ocean at the mid-Norwegian Margin. Therefore, we concluded that, when investigating past climate, we cannot make inferences about the impact of the NwASC on regional climate solely based on its past strength. We also need independent information about the temperatures of the waters that it transported northwards from the northern North Atlantic.
The authors of both papers, Thornalley et al. (2009) and Tegzes et al. (2017), aimed to broaden our understanding of ocean circulation. The coring locations (sites marked by RAPiD-12-1K and HA in Fig. 1) were chosen with that in mind. Reconstructed and measured ocean temperatures at these locations may have a large advective component, and hence should never be used to assess global warming without careful prior analysis. In addition, the sediments south of Iceland did not record the last few decades, and thus cannot be used in any argument about the modern situation.
These local or regional patterns do not reflect global or hemispheric temperatures as inferred by the Breitbart article.
References:
- Andersson et al. (2003) Late Holocene surface ocean conditions of the Norwegian Sea (Vøring Plateau). Paleoceanography.
- Risebrobakken et al. (2011) Early Holocene temperature variability in the Nordic Seas: The role of oceanic heat advection versus changes in orbital forcing. Paleoceanography.
- Risebrobakken et al. (2003) A high-resolution study of Holocene paleoclimatic and paleoceanographic changes in the Nordic Seas. Paleoceanography.
- Tegzes et al. (2017) Northward oceanic heat transport in the main branch of the Norwegian Atlantic Current over the late Holocene. The Holocene.
- Thornalley, Elderfield and McCave (2009) Holocene oscillations in temperature and salinity of the surface subpolar North Atlantic. Nature.
Wenfeng Deng, Associate Research Fellow, Guangzhou Institute of Geochemistry
Our results indicate that the Current Warm Period (AD 1850-present) is similar to or even warmer than the Medieval Climate Anomaly (AD 900-1300) over the western Pacific. Therefore, the Breitbart article misunderstood and overinterpreted our results and conclusions.
Tomi Luoto, Adjunct Professor, University of Jyväskylä
Our graph presents the relationship between temperature and precipitation (not a temperature record) and cannot be used to interpret anthropogenic climate change directly.
Florin Pendea, Associate Professor, Lakehead University Orillia
The claim that our paper Pendea et al. (2017) published in the Quaternary Science Reviews brings support to the notion that anthropogenic global warming doesn’t exist is completely false. The story circulated by Breitbart news represents a gross misunderstanding of the data presented in our paper. The data we present constitutes a record of millennial-scale environmental change in the North Pacific that has no relevance to the discussion around the global warming trend observed during the last 150 years in a vast number of environmental archives around the world.
Guocheng Dong, State Key Laboratory of Loess and Quaternary Geology, Chinese Academy of Sciences
Our paper published in The Holocene has not shown anything about human-caused global warming. I believe that misunderstanding may have occurred.
Miloš Rydval, University of St. Andrews
In the Rydval et al 2017 article, we clearly and repeatedly emphasize that there is a considerable amount of uncertainty associated with our temperature reconstruction and this generally increases further back in time and is related to, among others, data availability. This point is discussed in considerable detail in the paper and is a matter that was entirely ignored by the source cited in the Breitbart article. Thus, the cited statement: “[the reconstruction] suggests that the recent summer-time warming in Scotland is likely not unique when compared to multi-decadal warm periods observed in the 1300s, 1500s, and 1730s …” was taken out of context and misrepresented. The cited source conveniently omitted the second part of the sentence which highlights uncertainty in the earlier parts of the reconstruction and includes a cautionary statement about the interpretation of those periods. Also, it should be noted that our study provides information about conditions in and around Scotland, and is therefore not a representation of the average global trends of temperature change over time, but instead represents local scale variability. Importantly, there is nothing in our paper that in any way contradicts recent anthropogenic climate change and its causes.
