- Climate
Breitbart article falsely claims that measured global warming has been “fabricated”
Reviewed content
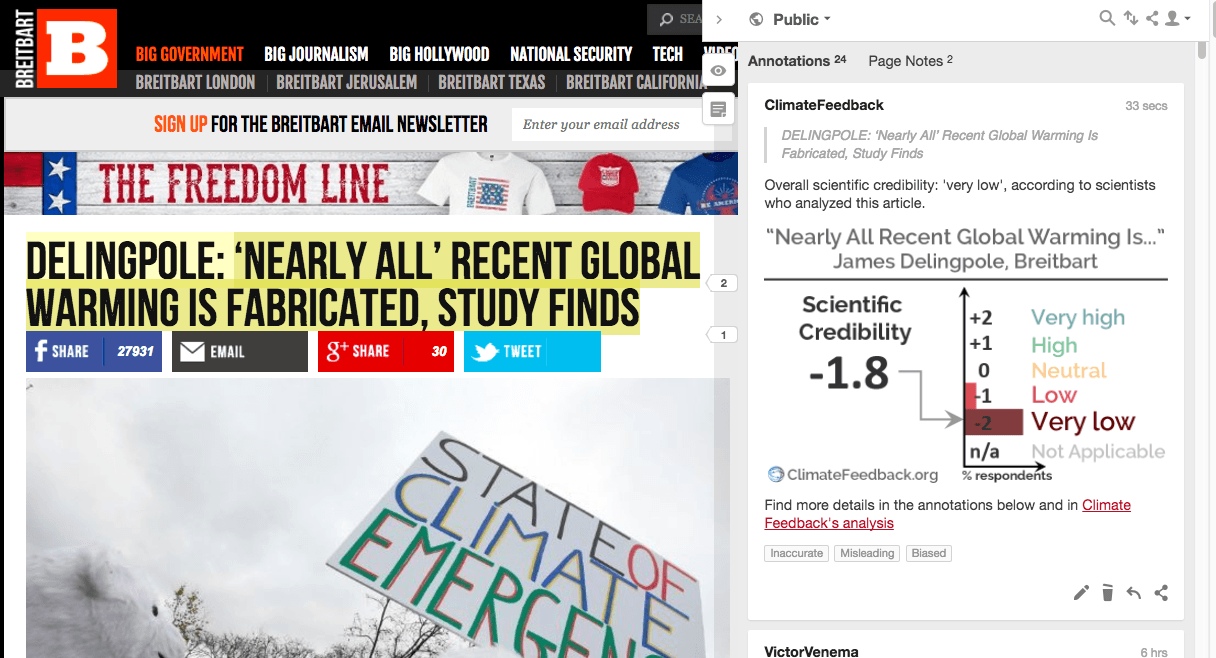
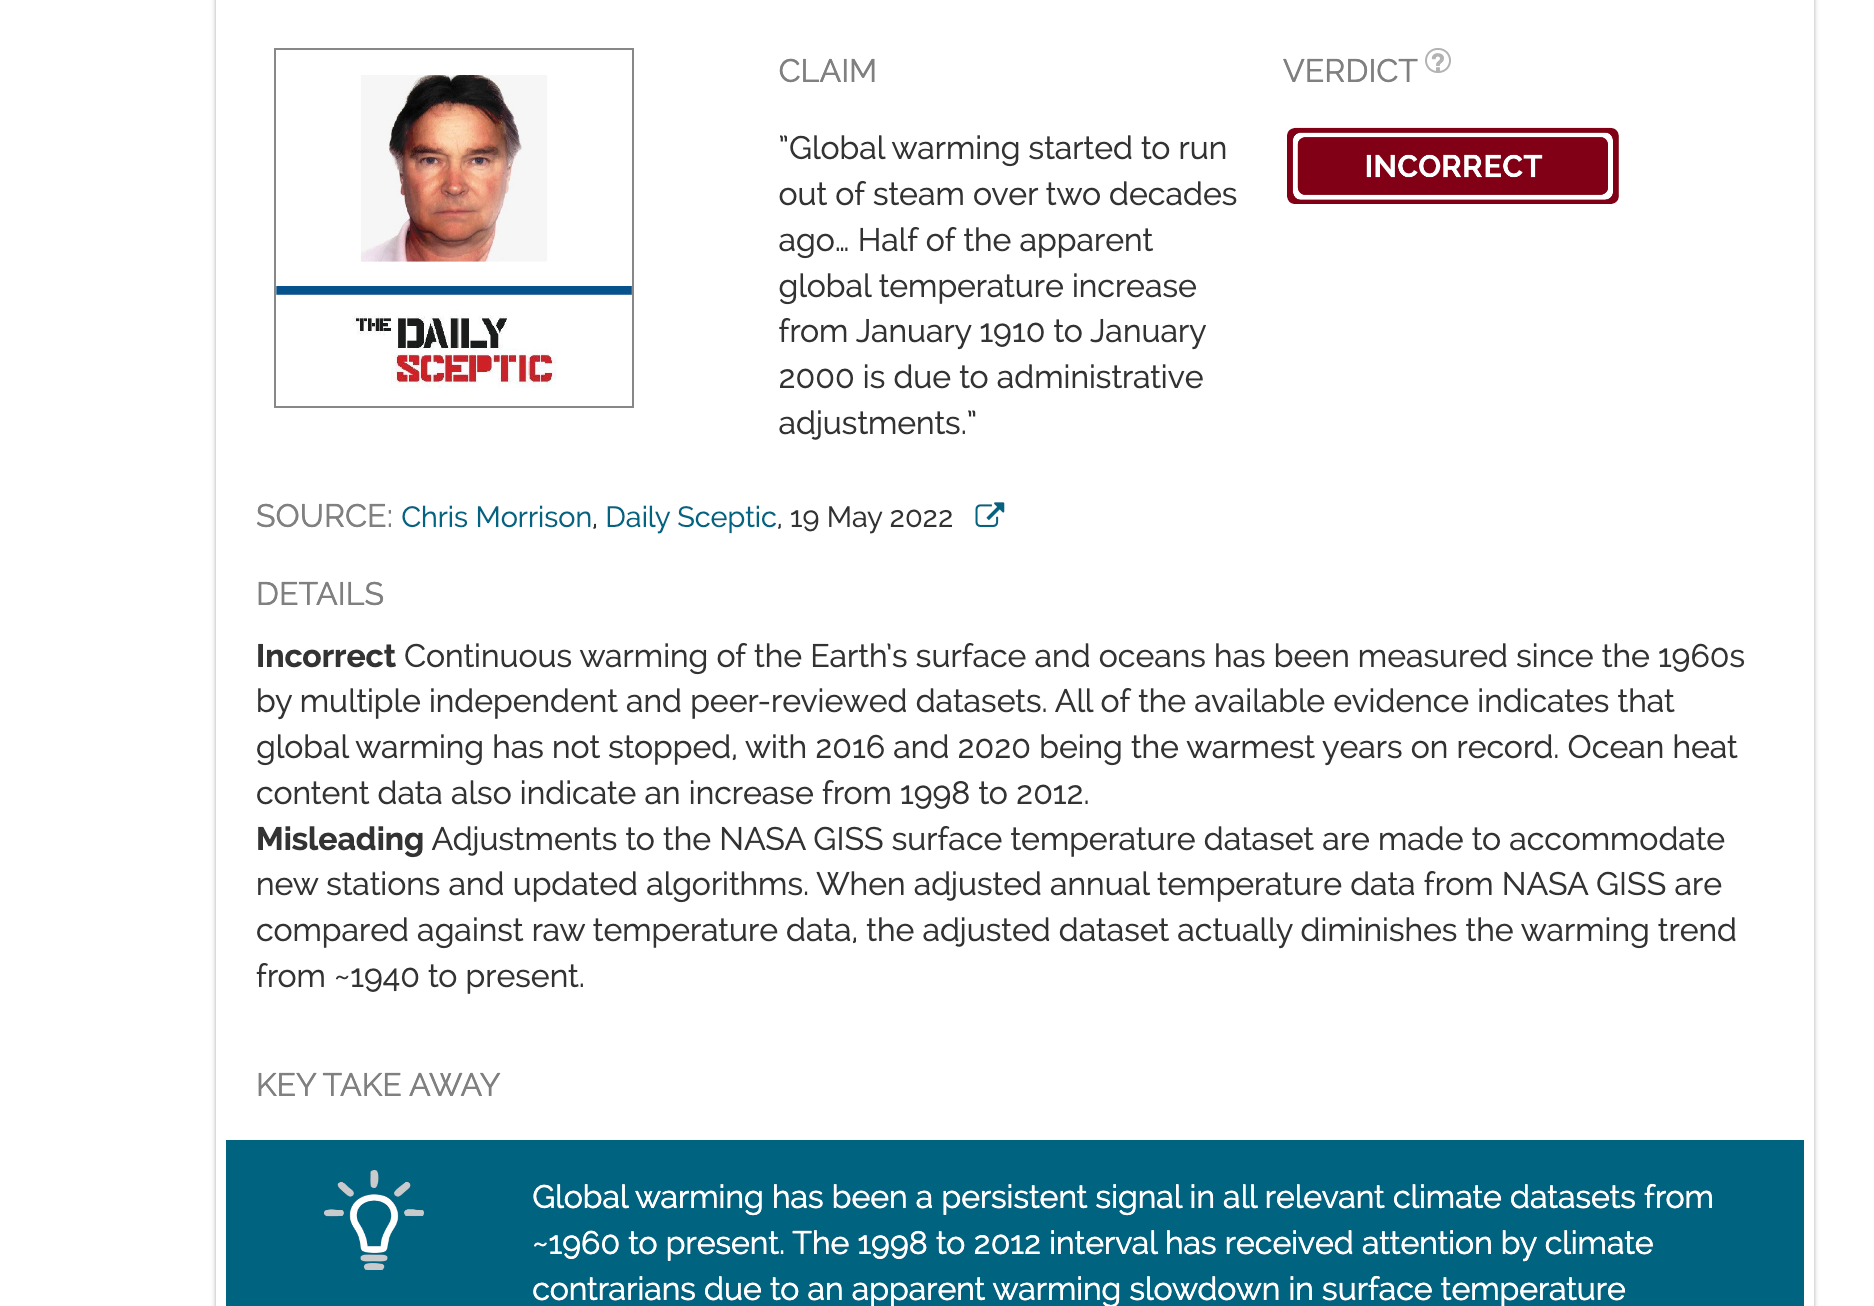
Headline: "‘Nearly All’ Recent Global Warming Is Fabricated, Study Finds"
Published in Breitbart, by James Delingpole, on 2017-07-09.
Scientists’ Feedback
SUMMARY
This Breitbart article by James Delingpole claims that the observed warming of Earth’s surface temperatures is largely a fabrication by scientists who have altered the measurements. The source for this claim is a document written by three individuals who have no track record of publishing scientific research on the topic, and have not submitted their work to peer-reviewed scientific journals, but simply uploaded a pdf on a wordpress blog.
Scientists who reviewed the article found that its claims are false and misleading. Data are indeed adjusted to accurately account for things like changes in the instruments used to make measurements or the relocation of weather stations. However, the impact of these adjustments on the global temperature record is actually small, and the warming trend of the last century would appear to be larger without the adjustments, in contradiction with the claims in the Breitbart article.
See all the scientists’ annotations in context
GUEST COMMENTS

Director of Climate and Energy, The Breakthrough Institute
In general, their argument about removing cyclical behavior comes from comparing old 1980s NASA GISTemp records to those of today. What they don’t tell you is that the 1980 record in question (in addition to being graphed on a different baseline than all the other series) only comes from around 500 land stations almost entirely in the Northern Hemisphere and does not include any ocean data at all.
There is a well known warm period in the mid-to-high latitude land areas of the Northern Hemisphere in the 1930s and 1940s, but it does not really show up much in the oceans and not at all in the S Hemisphere. As scientists have collected more historical temperature records from around the world in the past 35 years, we have created more complete records that show less warmth in that period simply because they cover more of the planet. See the NASA website for a good discussion of this.
Ultimately all of these comparisons to past records are a bit of a distraction. We have all the raw temperature records today, and we can compare them to the adjusted data to see what, exactly, adjustments do to the temperature record. It turns out that adjustments actually result in less warming over the past century, not more. If we scientists were “cooking the books”, then we are doing so in the wrong direction.
REVIEWERS’ OVERALL FEEDBACK
These comments are the overall opinion of scientists on the article, they are substantiated by their knowledge in the field and by the content of the analysis in the annotations on the article.

Professor, Maynooth University
Firstly, as far as I can tell the report [the article is based on] is not published in the peer reviewed literature, yet that is the strong implication given. Then the central money figure is grossly misleading. It takes the difference between consecutive versions of the NOAA NCEI product and purports that these differences are the adjustments being applied to the raw data. I think the only phrase one could, with any validity, use here is “not even wrong”. Both the series have been adjusted, and to pretend otherwise is either showing willful ignorance or duplicity. Taking the difference solely shows the change in adjustments applied and not the total adjustments as is being implied. Indeed, the total common adjustments being applied to both versions of the NOAA NCEI product dwarf those being shown. And the biggest adjustment of all—and only one that really matters—is that applied to account for the move from bucket measurements to engine room intakes over the oceans in the (pre-)WW2 period. This adjustment serves to greatly reduce (not increase) the centennial scale surface temperature trend.
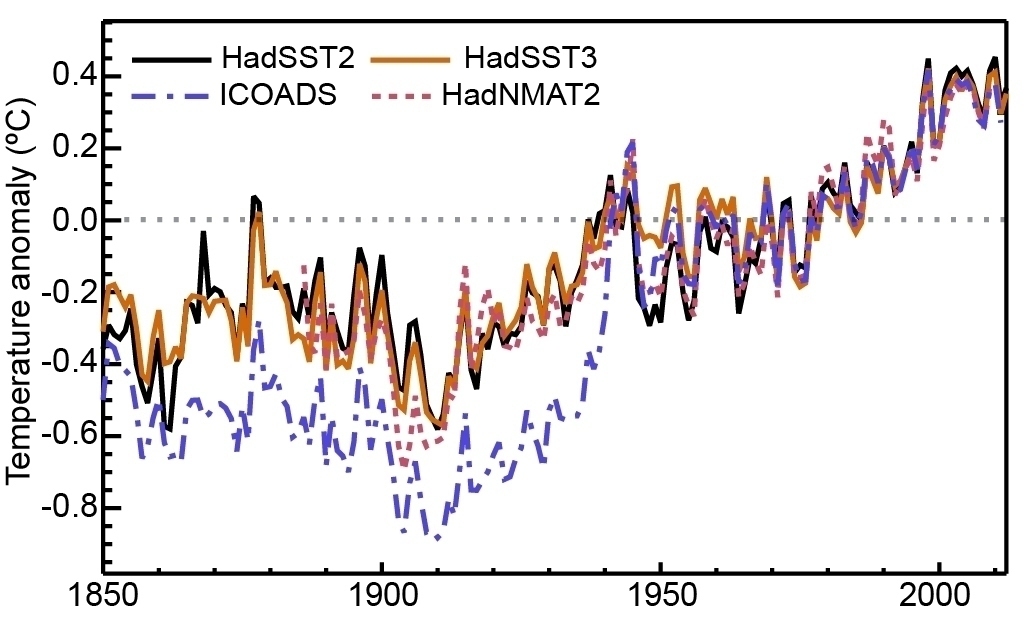
Source: IPCC AR5 Fig 2.16 (The blue line—”ICOADS”—is the uncorrected data.)
Finally, the finding of unequivocal warming does not rest solely upon surface temperature records. Rather it relies upon a broad suite of indicators (see e.g. FAQ2.1 of IPCC AR5) that all point unambiguously to the conclusion that Earth is running a fever. These findings and the recent surge in temperatures are corroborated by a broad range of other non-physical indicators (phenology, etc.) and also by a suite of modern reanalysis products. For so many analyses to be wrong is all but impossible. If the authors are correct they must explain away all these very many corroborating lines of evidence put together by a diverse range of groups using a huge range of measurements and analysis techniques. They can’t, and they won’t, instead preferring to cast doubt on small details, and making misleading assertions, all the while fervently hoping that their audience misses the big picture, to sow doubt and confusion.

Senior Scientist, Woods Hole Research Center
The authors of this article and of the study it references clearly have a very limited understanding of the painstaking methods used to ensure that surface temperature records are based on correct and unbiased measurements. Temperature databases from major scientific groups world-wide agree with each other, and also with measurements from independent sources, such as satellites.

Professor, McGill University
The article is mostly misleading because it gives evidence (a graph) that does not support the interpretation that is in given in the text. A reader would have to be somewhat knowledgeable about global warming to realize that the interpretation is unjustified.

Assistant Research Professor, University of Minnesota
In a cursory attempt at both reporting and climate science, the author glibly highlights a document heavy on accusation and light on reasoned engagement with fact. Implying nefarious motives behind temperature measurement bias correction without providing readers any indication of why this is necessary is misleading and a dereliction of the author’s journalistic responsibility.
Notes:
[1] See the rating guidelines used for article evaluations.
[2] Each evaluation is independent. Scientists’ comments are all published at the same time.
Key Take-aways
The statements quoted below are from the article; comments and replies are from the reviewers.
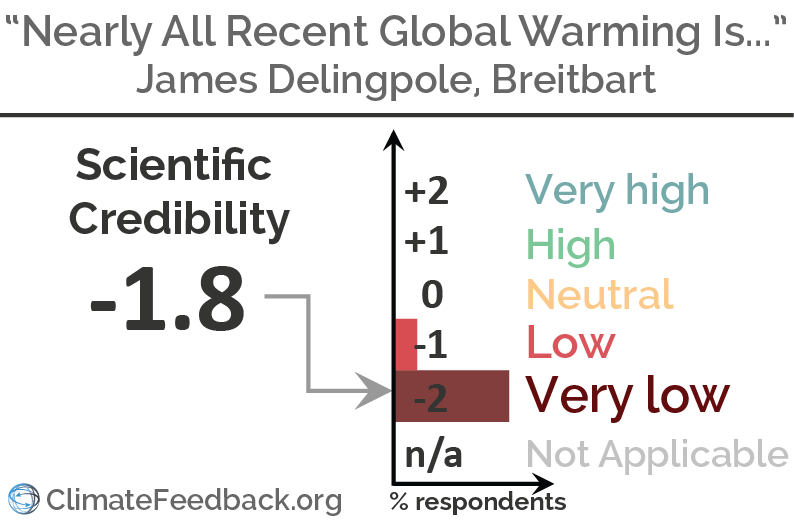
“‘Nearly All’ Recent Global Warming Is Fabricated, Study Finds”

Scientist, University of Bonn, Germany
The entire study could not have been more wrong in three clear ways.
1. The adjustments are scientifically important, but rather modest for the global mean temperature.
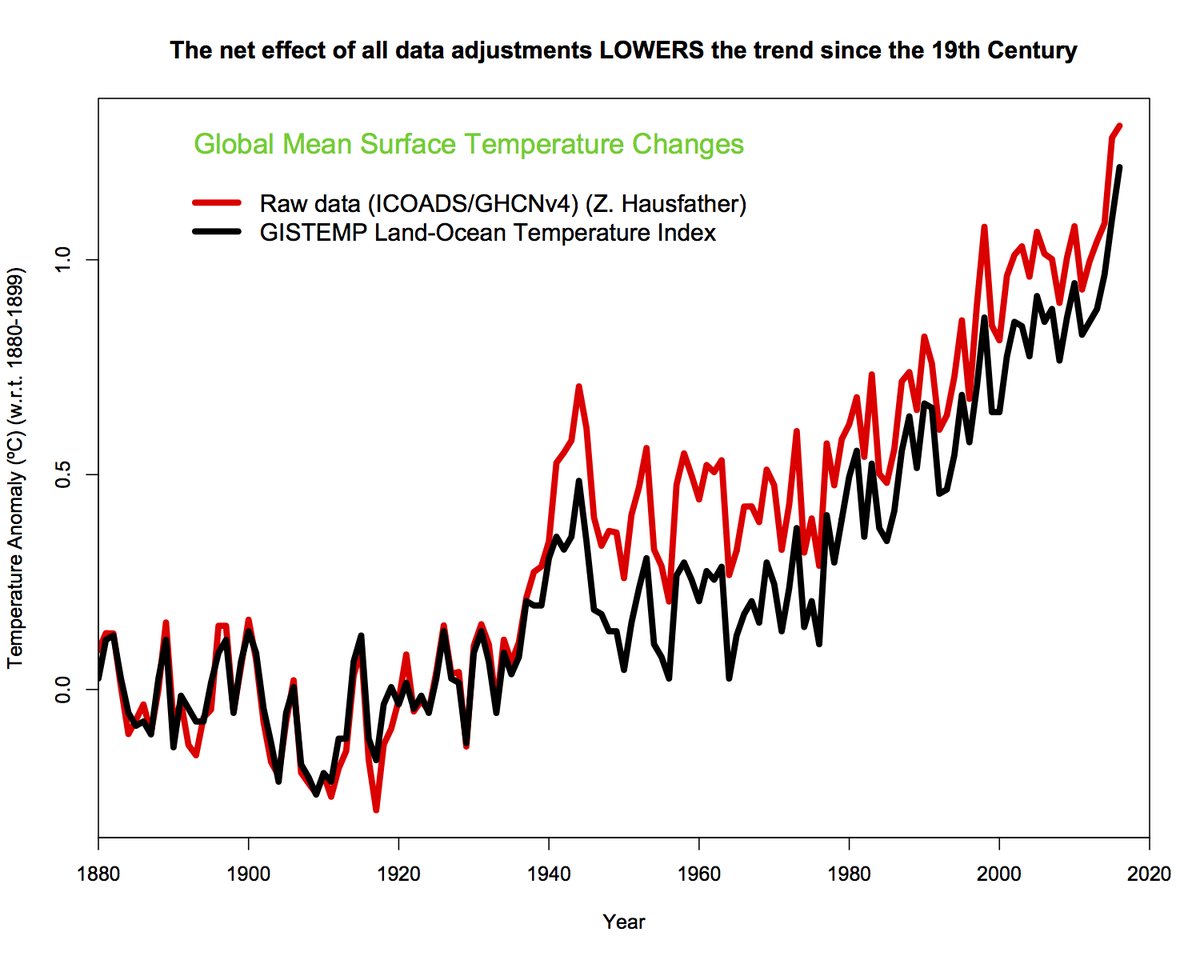
2. The adjustments make the estimated warming smaller, not larger. Below are, for example, the raw and adjusted warming signals of the NASA GISS dataset. The how and why is discussed in this post.
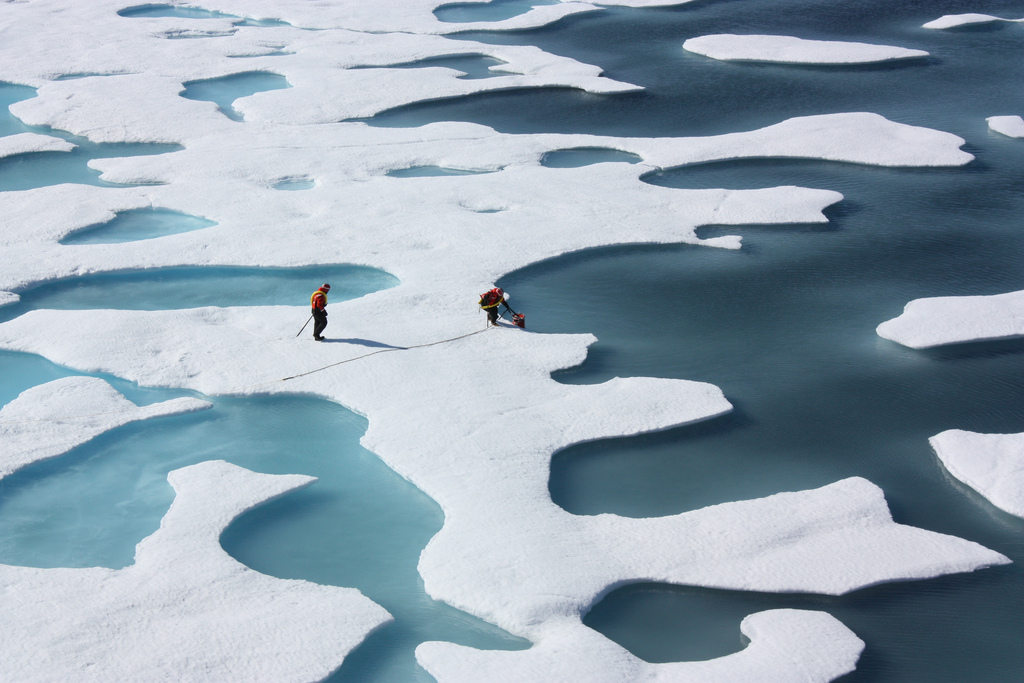
3. Also without any thermometer it would be clear that the Earth is warming. Just look at sea ice, sea level rise, melting glaciers, later river freezing, earlier ice breakup, earlier spring and animal migration, movement of animals, plants, insects and ecosystems towards to poles and up mountains, etc.
“the adjusted data”
Assistant Research Professor, University of Minnesota
It is surprising that, despite adjusted data being the crux of the arguments made here and in the study referred to, the author never explains why one may need to adjust measurements made on the ground or by satellites. There has been significant media coverage recently of some of the adjustments relating to temperature measurements made by satellites.
Simply from a practical standpoint, it is beneficial to consider what is involved in sustaining the orbit of a satellite. Once put into orbit, a satellite will slowly “decay” away from its intended orbit as it is pulled nearer to Earth by gravity and other effects. Unless it has its own propulsion to correct for this, it will eventually be pulled out of orbit.
This decay affects the exact time of day during which the satellite repeats measurements over one location. For example, from 1995 to 2005, the time of day that a NOAA satellite (NOAA-14) passed over the equator changed by more than 6 hours. The temperature in Quito at 12pm local time versus 6pm local time is quite different, so the satellite measurement must be corrected for this and other effects. More details from this excellent article by Zeke Hausfather.
“alarmist organizations like NASA, NOAA, and the UK Met Office differs so markedly from the original raw data that it cannot be trusted.”
Assistant Research Professor, University of Minnesota
These are some of the most respected, independent and transparent institutions collecting and ensuring free and open access to climate data of the highest quality. If it were not for these agencies, our ability to evaluate global temperature trends at all would be in the stone age. It might be more useful to thank these international agencies for providing data with which the author makes their arguments.
Scientist, University of Bonn, Germany
The differences between the raw and the adjusted data are small for the global mean temperature. The warming estimated from adjusted data is smaller than it would have been without taking changes in the way observations were made into account.
“This chart gives you a good idea of the direction of the adjustments.”
Professor, Maynooth University
The chart provides solely a view as to the changes in applied adjustments between consecutive versions of one product. It does not reflect the totality of the adjustments being applied. Showing total adjustments would highlight that these deltas were dwarfed by the existing adjustments applied to the 2008 version. Specifically, the very large spurious warming resulting from biases in the raw marine data record over the late 1930s / early 1940s. The net effect of adjustments in all datasets is to reduce the centennial timescale warming in all the surface temperature products.
Scientist, University of Bonn, Germany
This chart does not show the adjustments. It shows an unsourced graph with the difference between two datasets. This is also due to increases in the amount of data used and thus also increases in coverage.
In as far as the reason are adjustments, a likely reason would be the adjustments of the sea surface temperature that make global warming smaller. Older bucket measurements are cooler than modern buoy measurements because the water cools by evaporation between taking the bucket out of the water and reading the thermometer. In the past these adjustments were thought to be larger than modern estimates.
So the “scandal” here would be that scientists were conservative in their early estimate of global warming.
“The blue bars show where the raw temperature data has been adjusted downwards to make it cooler; the red bars show where the raw temperature data has been adjusted upwards to make it warmer.”
Professor, Maynooth University
It does no such thing as both the series are adjusted. Hence it is impossible from the graph as constructed to make such an inference. To do so would require taking the adjusted data away from the raw data which is not what is being done here.
Senior Scientist, Woods Hole Research Center
Adjustments are made for good reasons. One of the most common ones is to account for a station located in a growing city, where the urban heat island effect would add spurious warming. In most cases the adjustments reduce, not increase, the warming in the record.
“Note how most of the downward adjustments take place in the early twentieth century and most of the upward take place in the late twentieth century.”
Professor, McGill University
Even if all the adjustments were unjustified (as the Breitbart piece implies), they would only change the magnitude of the overall warming by about 0.1 °C; from about 1 °C to about 0.9 °C. This graph is nearly irrelevant to the question of anthropogenic warming!
It could also be mentioned that the 20th Century reanalysis* which uses NO temperature data from any stations found almost an identical warming (to within 0.1 °C) as 5 other series based on station data. The information in the Breitbart graph is irrelevant to the issue of anthropogenic warming; it is at most a footnote.
- Compo et al (2013) Independent confirmation of global land warming without the use of station temperatures, Geophysical Research Letters
- Lovejoy (2017) How accurately do we know the temperature of the surface of the earth?, Climate Dynamics
“Each dataset pushed down the 1940s warming”
Scientist, University of Bonn, Germany
The second world war increased the percentage of American navy vessels, which make engine intake measurements, and decreased the percentage of merchant ships, which make bucket measurements.
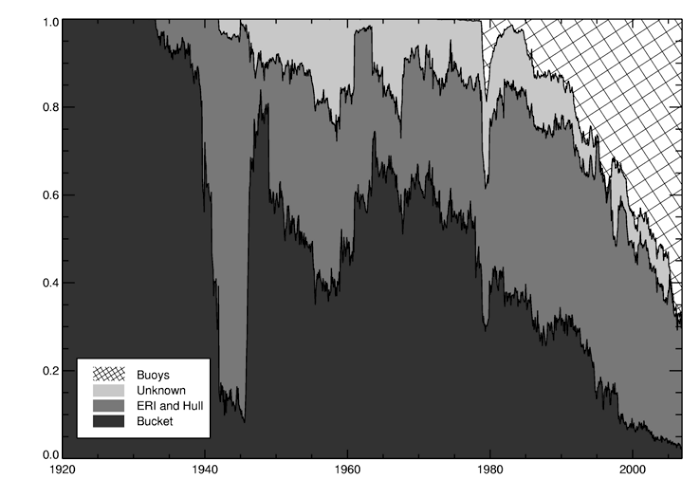
Source: UK MetOffice
Engine intake observations are typically warmer than bucket measurements because the water cools due to evaporation before the thermometer is read. That produces a spurious warm peak in the raw data.
“cyclical temperature patterns”
Scientist, University of Bonn, Germany
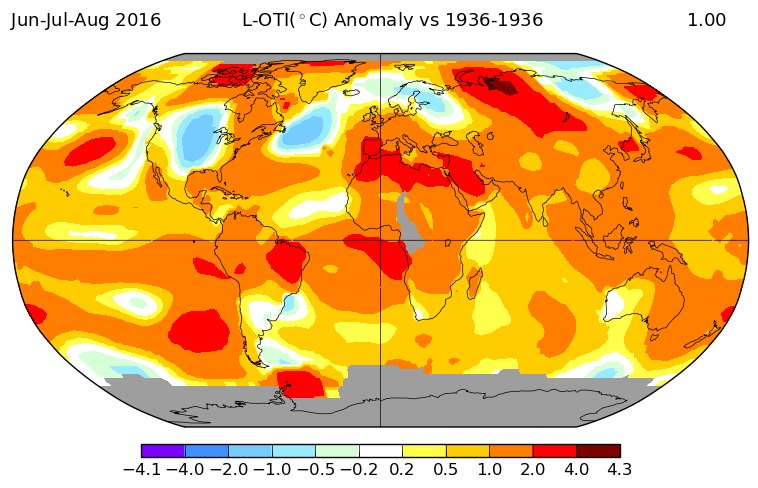
The report wants to see the summer heat waves of the Dust Bowl in America in the 1930s in the global average annual mean temperature.
The figure below shows the summer temperature difference between the Dust Bowl year 1936 and now. The affected area, which was warmer in 1936 than now (blue), is about 2% of the Earth’s surface.
“The peer-reviewed study by two scientists and a veteran statistician looked at the global average temperature datasets[…]”
Professor, Maynooth University
As far as I can tell the linked report is not accepted for any journal and thus peer-reviewed is willfully misleading at best.

Research Scientist, Cold Regions Research and Engineering Lab
In addition to not being peer reviewed, the study also doesn’t appear to cite ANY peer-reviewed literature to support its conclusions, nor does the report provide any additional references. Furthermore, the report appears to have a clear dismissive tone towards peer-reviewed research and uses dubious language such as “Climate Alarmist”, further straining the credibility of the report this article is based solely on.
Senior Scientist, Woods Hole Research Center
If this author knew anything about the process of scientific research and publication, he would realize just how ridiculous this statement is. Note that the study reported in this article has not been published in any reputable peer-reviewed journal, undoubtedly because it would never pass muster.
“used by climate alarmists to argue that recent years have been “the hottest evah” and that the warming of the last 120 years has been dramatic and unprecedented.”
Professor, Maynooth University
The IPCC AR5 concluded that warming was unequivocal. This finding rested upon a wealth of evidence and not solely upon surface records. However, each decade for the past three decades has been warmer than all preceding decades in the instrumental record by a greater extent than quantified uncertainties. This finding applies using older or newer versions of the datasets.
“Nearly all of the warming they are now showing are in the adjustments.”
Scientist, University of Bonn, Germany
That amounts to the claim that the Earth is not really warming. Even without looking at any thermometer data, even if we would not have invented the thermometer we would know it is warming:
Glaciers are melting, from the tropical Kilimanjaro glaciers, to the ones in the Alps and Greenland. Arctic sea ice is shrinking. The growing season in the mid-latitudes has become weeks longer. Trees bud and blossom earlier. Wine grapes can be harvested earlier. Animals migrate earlier. The habitat of plants, animals and insects is shifting poleward and up the mountains. Lakes and rivers freeze later and break up the ice earlier. The oceans are rising.