- Climate
Warming of Earth’s surface and oceans continues apace, contrary to claims in blog
Key takeaway
Global warming has been a persistent signal in all relevant climate datasets from ~1960 to present. The 1998 to 2012 interval has received attention by climate contrarians due to an apparent warming slowdown in surface temperature datasets, which may be due to a combination of natural and internal variability as specifically noted in the Intergovernmental Panel on Climate Change’s Sixth Assessment Report. However, warming did occur throughout this interval and continues to the present day as shown in measurements of surface temperature, ocean heat content, glacier melt and sea-level rise.
Reviewed content
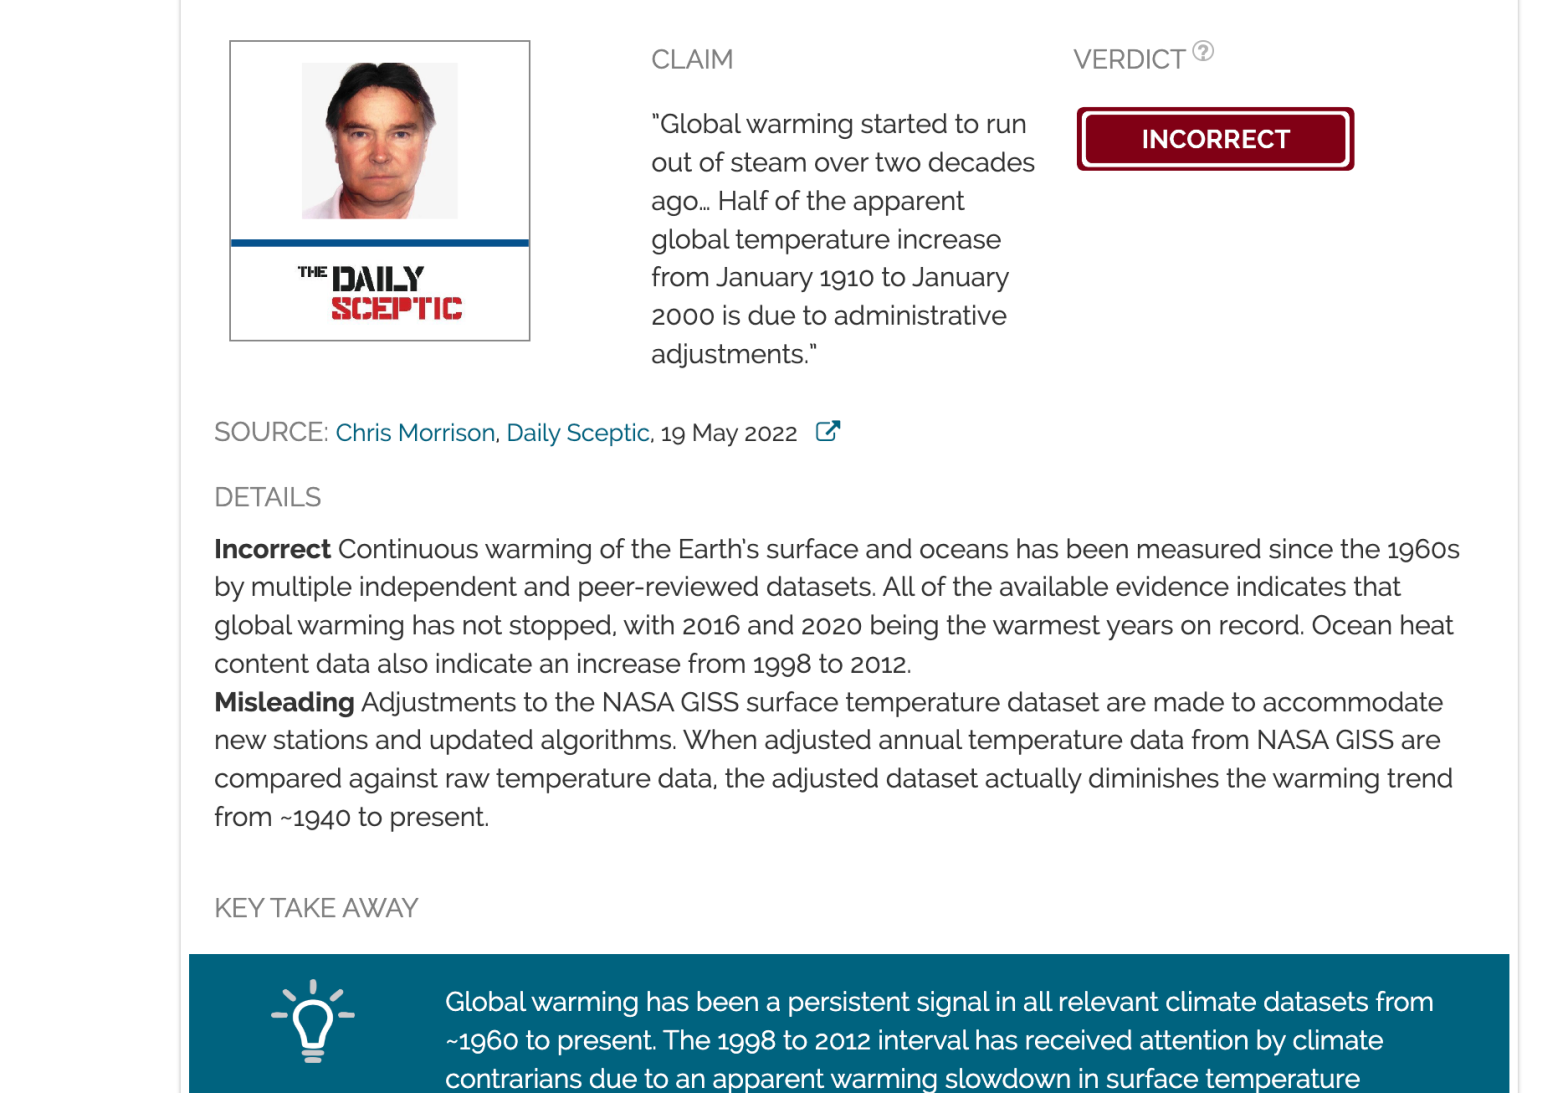
Verdict:
Claim:
”Global warming started to run out of steam over two decades ago… Half of the apparent global temperature increase from January 1910 to January 2000 is due to administrative adjustments.”
Verdict detail
Incorrect Continuous warming of the Earth’s surface and oceans has been measured since the 1960s by multiple independent and peer-reviewed datasets. All of the available evidence indicates that global warming has not stopped, with 2016 and 2020 being the warmest years on record. Ocean heat content data also indicate an increase from 1998 to 2012.
Misleading Adjustments to the NASA GISS surface temperature dataset are made to accommodate new stations and updated algorithms. When adjusted annual temperature data from NASA GISS are compared against raw temperature data, the adjusted dataset actually diminishes the warming trend from ~1940 to present.
Full Claim
”In a major re-evaluation of data from meteorology balloons rising through the troposphere, the scientists confirmed that temperatures have mostly paused since around 1998. In July 2013, the Met Office published a paper about the [1998 to 2012] pause, although its main argument that the heat had disappeared into the ocean does not seem to have stood the test of time. Professor Humlum looked at the adjustments to the NASA GISS [surface temperature] dataset and found that ‘half of the apparent global temperature increase from January 1910 to January 2000 is due to administrative adjustments to the original data since May 2008.’”
In a recent article in the Daily Sceptic, a website with a history of publishing scientifically unfounded claims, Chris Morrison repeats a common claim in contrarian circles that “global warming has slowed dramatically” since 1998. Morrison, who presents himself as a former financial journalist, further goes on to downplay past warming, claiming that “half of the apparent global temperature increase from January 1910 to January 2000 is due to administrative adjustments to the original [NASA Goddard Institute for Space Studies (GISS) surface temperature] data since May 2008”. This claim that global warming is due to data adjustment has been shown false in the past, as re-explained below.
Temperature corrections are made to accommodate new stations and updated algorithms used to produce the dataset, says Gavin Schmidt, a climate scientist and director of GISS. Schmidt also notes that changes in temperature among different versions of the dataset are “very small compared to the changes over time because of climate” (Fig. 1). Moreover, the corrections applied to the NASA GISS dataset actually reduced the temperature increase from ~1940 to present, rather than accentuated it, as claimed by Morrison (Fig. 2).
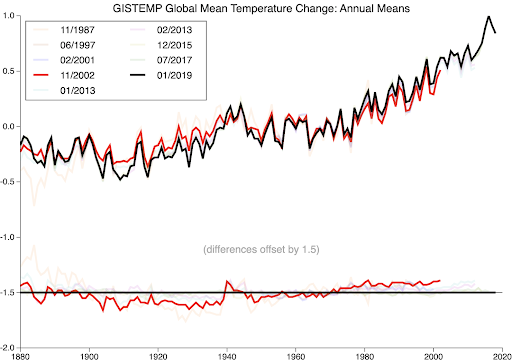
Figure 1. Different versions of the GISS global mean temperature time series. Note that the small adjustments to the dataset invoked by Morrison are not sufficient to negate the clear warming trend. Source: NASA GISS.
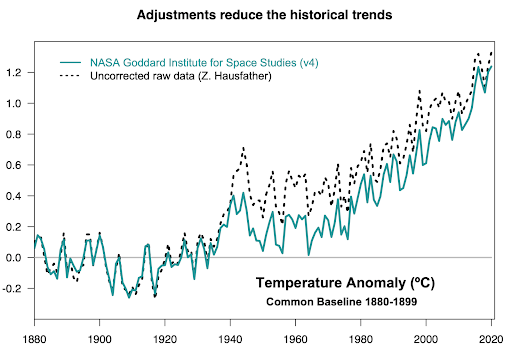
Figure 2. NASA GISS adjusted temperature anomalies (teal) compared to raw unadjusted data (black). Note that the adjustments made to the GISS time series suppress the warming trend since ~1940, rather than accentuate it as claimed by Morrison. Source: NASA Climate.
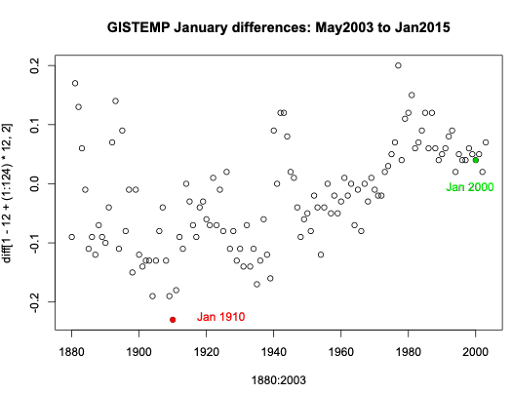
Then how did Morrison and Ole Humlum, a geographer at the University of Oslo quoted in the article, conclude that these corrections resulted in much larger impacts on the final dataset when comparing temperatures for January 1910 and January 2000? “This is just a cherry pick,” says Schmidt. “There is a lot of noise in the monthly data, and this particular comparison is just the largest adjustment he could find. If he had looked at January 1881, the adjustments reduced the difference to Jan 2000 by about 0.1 ºC.”
“Regardless of what record you look at, [warming] trends have continued through 1998. In all records, 2016 or 2020 were the warmest years on record,” says Schmidt (Fig. 3). Continued warming is indeed reinforced by findings from the latest national and international climate reports such as the U.S. National Climate Assessment[1], the Intergovernmental Panel on Climate Change’s Sixth Assessment report (IPCC AR6)[2], the American Meteorological Society’s State of the Climate in 2020 report[3] and the World Meteorological Organization’s State of the Global Climate 2021 report[4]. The available evidence is therefore in clear contrast to Morrison’s claim that “temperatures have mostly paused since around 1998.”
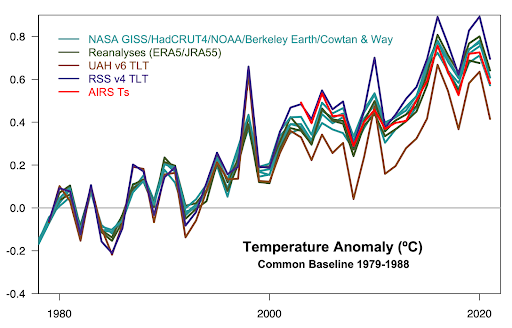
Figure 3. Temperature anomalies from different datasets since the late 1970s. Note that the warming trend continues from 1998 to present, in clear contrast to claims made by Morrison. Source: RealClimate.
Fabio Madonna, an atmospheric scientist at the Italian National Research Council and lead author of the study[5] invoked by Morrison, agrees with Schmidt. “In my paper, it is never mentioned that temperatures have mostly paused since around 1998,” says Madonna. “The analysis of the time series of upper-air data shows that in 1998 something happened (likely boosted by a strong El Niño [a shift in Pacific Ocean circulation patterns that impacts temperature records[6]]) with a slow down of the warming of the upper troposphere in the northern hemisphere only.”
There are therefore two major problems with Morrison’s argument: first, it relies exclusively upon data from the upper troposphere in only a portion of the northern hemisphere, which is not representative of global climate trends. As Victor Venema, a climate scientist at the University of Bonn, says, “[Morrison’s] ‘evidence’ seems to be his own eye-ball estimate of warming for a small part of the Earth, the air 9-km up in the northern hemisphere between 20 and 70 °N, which is not global. Compared to the actual global temperature this would be missing the strong warming we have recently seen in the Arctic.”
Secondly, using 1998 as a starting point is problematic, note climate scientists Andrea Steiner and Stephen Po-Chedley. “The positive temperature anomalies due to the strong El Niño leads to a trend dominated by this large peak,” says Steiner. Thus, Morrison’s reliance upon this time period is an example of cherry picking: selectively picking a particularly warm year as a baseline in order to downplay the warming trend.
Morrison continues to write that the Met Office’s “main argument that the heat [from 1998 to 2012] had disappeared into the ocean does not seem to have stood the test of time.” Morrison’s claim, however, is again in contradiction with ocean heat content data published by NOAA that show continuous warming of the upper 700 meters of the ocean since ~1990 (Fig. 4).
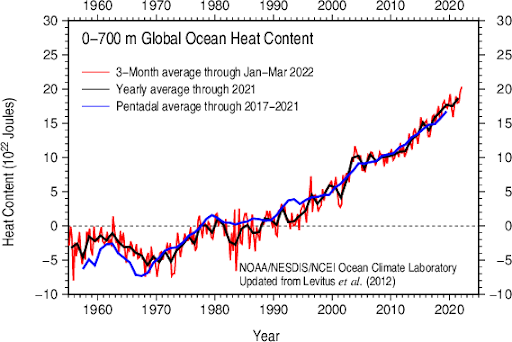
Figure 4. Time series of ocean heat content (upper 700 m). Note that the positive trend continues from 1998 to 2012, in contrast to Morrison’s claims of a warming “pause”. Source: NOAA.
Further, the IPCC AR6[2] provides specific comments on this particular interval, noting that the slower increase in surface temperature, “was a temporary event induced by internal and naturally-forced variability that partly offset the anthropogenic warming trend over this period. Nonetheless, the heating of the climate system continued during this period, as reflected in the continued warming of the global ocean (very high confidence) and in the continued rise of hot extremes over land (medium confidence).”
Annotations
The statements quoted below are from the article; comments are from the reviewers (and are lightly edited for clarity).
Daily Sceptic claim: “Temperature [increase] has mostly paused since around 1998”

Director, NASA Goddard Institute for Space Studies
Not true. Regardless of what record you look at (satellite or surface or reanalyses (like ERA5)), trends have continued through 1998. In all records, 2016 or 2020 were the warmest years on record (see Fig. 3).

Professor for Climate Analysis and Director, Wegener Center for Climate and Global Change, University of Graz, Austria
This is a misleading statement. Using 1998 as a starting point with the positive temperature anomalies due to the strong El Niño leads to a trend dominated by this large peak. Current best estimates of atmospheric temperature trends have been published in several peer-reviewed journals and assessed by the recent IPCC 6th Assessment Report[2] of WG I. Chapter 2 of the report shows the observed changing state of the climate system. Fig. 2.12 shows atmospheric temperature trends. Temperature increase has definitely not paused, the troposphere has been warming (Table 2.5). For more information and also surface trend estimates see chapter 2.3.1.

Scientist, Italian National Research Council
The IPCC AR6 considered the totality of evidence to conclude that the troposphere has warmed since at least the 1950s. In the tropics, the upper troposphere has warmed faster than the near-surface temperatures since at least 2001. This is the most general view agreed by the scientific community. In my JGR paper[5], it is never mentioned that “temperatures have mostly paused since around 1998.” The analysis of the time series of upper-air data shows that in 1998 something happened (likely boosted by a strong El Niño) with a slow down of the warming of the upper troposphere in the northern hemisphere only. Moreover, the results at 300 hPa in the tropics show, instead, a significant warming after 2000 at 300 hPa in line with the statements by IPCC. After 2015 the warming has largely sped up globally: this is also accompanied by an increase of relative humidity in the southern hemisphere (again likely boosted by another strong El Niño). This is also commented on in my paper. The last 5-6 years of strong warming are also reported in several bulletins and journal papers. The warming/cooling in the upper-troposphere is not immediately related to the near surface temperature trends: if from one side there is a correlation among different vertical regions in the atmosphere, from another side it is also true that changes are reflected in each region with different “sensitivities”. For example, in the JGR paper, where I do not investigate any near surface temperature data, I show that at 300 hPa in the Northern Hemisphere, the decadal temperature trend in the period 1978 – 2018 is 10-20% smaller than the trends at 850 hPa (about 1.5 km of altitude), while in the tropics the warming trend at 300 hPa is 40-50 % larger than the trend at 850 hPa. Investigating trends is a very delicate task because uncertainties affecting the trend estimation are very often larger than the trend themselves. Moreover, the interpretation of trends values must be seen in a global context and over a long time period to ensure that the data analysis may clearly reveal the “fingerprints” of climate change.

Research Scientist, Lawrence Livermore National Laboratory
First, the Earth is warming due to anthropogenic emissions of greenhouse gases. The rate of warming is influenced by natural variations in the Earth’s climate (e.g., volcanic eruptions and El Niño events). Consideration of longer time periods reduces the impact of natural variations in Earth’s climate on anthropogenic warming. Choosing a starting point of 1998 is cherry picking and misleads readers (there was a large El Niño over 1997 – 1998). Second, despite the above disclaimer, it is not true that temperature changes have paused since around 1998. Across all lower tropospheric datasets (UAH, RSS, ERA5, JRA-55, RATPAC, RICH, and RAOBCORE) used in the State of the Climate Report[3] (the peer-reviewed version, not the version by the Global Warming Policy Foundation think tank cited in the article) there is warming over 1998 – 2021. On average, the post-1998 warming is 0.22 K per decade (with a range of 0.11 – 0.30 K per decade across datasets). Note that other papers that consider radio occultation measurements (available over 2002 – 2018) also show rapid tropospheric warming[7]. The new dataset and publication cited by the Daily Sceptic did not analyze the period after 1998 and does not purport that temperature change has paused.

Scientist, University of Bonn, Germany
This is not supported by the evidence. For example the recent IPCC report shows consistent warming over the last 4 to 5 decades. See figure below, which is Figure 2.11c from the IPCC (2021) report[2]:
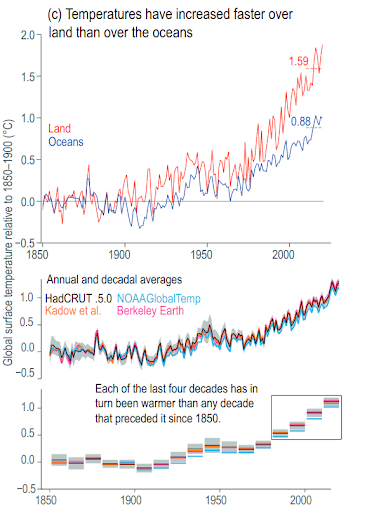
The only new information the article presents is not about global warming, which normally points to the warming of the surface temperature, but about the upper air temperature (around 9 km up in the air). And the “evidence” is only one dataset of many. The upper air temperature is valuable for many applications, but a much less reliable source for long-term trend computations. Measuring upper air temperature is much harder and instruments change regularly. It uses one-way instruments, which need to have a dynamic range of up to 100 °C, operate in clouds and with little ventilation in harsh sunlight. Also radiosondes are mostly launched over land and the data is really spare for the Southern Hemisphere. The article cites this new radiosonde dataset with upper air temperature data to claim “Further scientific evidence that global warming starting to run out of steam over two decades ago has been presented by an international group of leading scientists.” However, the article does not make any claims about slowing warming in the last 20 years. It even makes the opposite claim about the tropics: “For temperature (Figure 8) in the [Northern Hemisphere], IGRA, RHARM [The new dataset of this study], and ERA5 show a similar positive trend of 0.38, 0.39 and 0.43 K da −1 [that is degree per decade], respectively, while in the tropics at 300 hPa the trend is of 0.17, 0.25, 0.20 K da −1, with a more pronounced trend increase starting around 1997.” Chris Morrison shows a plot from the study. Thus his actual “evidence” seems to be his own research eye-ball estimate of warming for a small part of the Earth, the air 9-km up in the Northern Hemisphere between 20 and 70 °N, which is not global. Compared to the actual global temperature this would, e.g., be missing the strong warming we have recently seen in the Arctic.
Daily Sceptic claim: “Professor Humlum looked at the adjustments to the NASA GISS dataset and found that ‘half of the apparent global temperature increase from January 1910 to January 2000 is due to administrative adjustments to the original data since May 2008’”
Director, NASA Goddard Institute for Space Studies
This is just a cherry pick. There is a lot of noise in the monthly data, and this particular comparison is just the largest adjustment he could find. If he had looked at Jan 1881, the adjustments reduced the difference to Jan 2000 by about 0.1ºC.
But all of these adjustments – which happen because we’ve added stations, updated algorithms etc. – are very small compared to the changes over time because of climate (Fig. 2).
Scientist, University of Bonn, Germany
The term “administrative adjustments” is not used in science and comes from a report Humlum wrote for an anti-science Think Tank, the Global Warming Policy Foundation [GWPF]. This computation does not make much sense, but the same graph could have been used to claim that there was effectively no change in the “administrative adjustments” over the full period of the dataset. So even if the measure made sense, the claim would be a misleading cherry pick of a specific period. The claim seems to correspond to the often used conspiracy theory that an open group of thousands of scientists from all over the world and numerous disciplines are conspiring against humanity by pretending that the world warms more than it actually warms. An inconvenient fact for this conspiracy, which is normally not mentioned by people making the claim, is that the “homogenization adjustments” scientists make result in a smaller global warming estimate than the one one would make based on raw data without adjustments[8] (see Fig. 2). Had it been the other way around, it would still not have been sufficient to call it suspicious. Also, then it would have required an engagement with the science, the published reasons for the adjustments and the published evidence they make the warming estimates more accurate.
Professor for Climate Analysis and Director, Wegener Center for Climate and Global Change, University of Graz, Austria
Data records are continuously reprocessed and subject to improved quality control. There are several different groups that produce surface data sets, reaching similar conclusions while using different methods. The mentioned State of the Climate report of Prof Humlum [written for the GWPF] is not an independently peer-reviewed report according to scientific standards. The original “State of the Climate” report is an international peer-reviewed report in BAMS [Bulletin of the American Meteorological Society], written by dozens of scientists[3]. The most recent report on the year 2021 is still under peer-review. There is also the “State of the Global Climate” report by the World Meteorological Organization (WMO)[4].
Daily Sceptic claim: The argument that the heat [from 1998 to 2012] had disappeared into the ocean does not seem to have stood the test of time
Director, NASA Goddard Institute for Space Studies
The change of ocean heat is tracked by NOAA and sees continuous increases over this time (Fig. 4).
Professor for Climate Analysis and Director, Wegener Center for Climate and Global Change, University of Graz, Austria
See the statement below from Chapter 3 of the IPCC AR6 WGI[2], Cross Chapter Box 3.1:
“With updated observation-based GMST [Global Mean Surface Temperature] datasets and forcing, improved analysis methods, new modelling evidence and deeper understanding of mechanisms, there is very high confidence that the slower GMST and GSAT [Global mean Surface Air Temperature] increase inferred from observations in the 1998–2012 period was a temporary event induced by internal and naturally-forced variability that partly offset the anthropogenic warming trend over this period. Nonetheless, the heating of the climate system continued during this period, as reflected in the continued warming of the global ocean (very high confidence) and in the continued rise of hot extremes over land (medium confidence). Considering all the sources of uncertainties, it is impossible to robustly identify a single cause of the early 2000s slowdown[9,10]; rather, it should be interpreted as due to a combination of several factors.[11,12,13]”
References:
- 1 – U.S. National Climate Assessment (2018). Fourth National Climate Assessment.
- 2 – IPCC (2021). Sixth Assessment Report.
- 3 – American Meteorological Society (2021). State of the Climate in 2020.
- 4 – World Meteorological Organization (2021). The State of the Global Climate.
- 5 – Madonna et al. (2021). The New Radiosounding HARMonization (RHARM) Data Set of Homogenized Radiosounding Temperature, Humidity, and Wind Profiles With Uncertainties. JGR Atmospheres.
- 6 – NOAA (2016). El Niño and La Niña: Frequently asked questions.
- 7 – Steiner et al. (2020). Observed Temperature Changes in the Troposphere and Stratosphere from 1979 to 2018. Journal of Climate.
- 8 – Karl et al. (2015). Possible artifacts of data biases in the recent global surface warming hiatus. Science.
- 9 – Hedemann et al. (2017). The subtle origins of surface-warming hiatuses. Nature Climate Change.
- 10 – Power et al. (2017). Apparent limitations in the ability of CMIP5 climate models to simulate recent multi-decadal change in surface temperature: implications for global temperature projections. Climate Dynamics.
- 11 – Huber and Knutti (2014). Natural variability, radiative forcing and climate response in the recent hiatus reconciled. Nature Geoscience.
- 12 – Schmidt et al. (2014). Reconciling warming trends. Nature Geoscience.
- 13 – Medhaug et al. (2017). Reconciling controversies about the ‘global warming hiatus’. Nature.