- Climate
Incorrect claim that global warming is mostly natural was based on a study that can’t support that conclusion
Key takeaway
Natural changes in climate cannot explain recent global warming, while the human-caused increase in greenhouse gas concentrations matches the observed warming well. The analysis contained in this paper—which includes important mistakes—does not demonstrate that natural cycles are responsible for modern climate change.
Reviewed content
Verdict:
Claim:
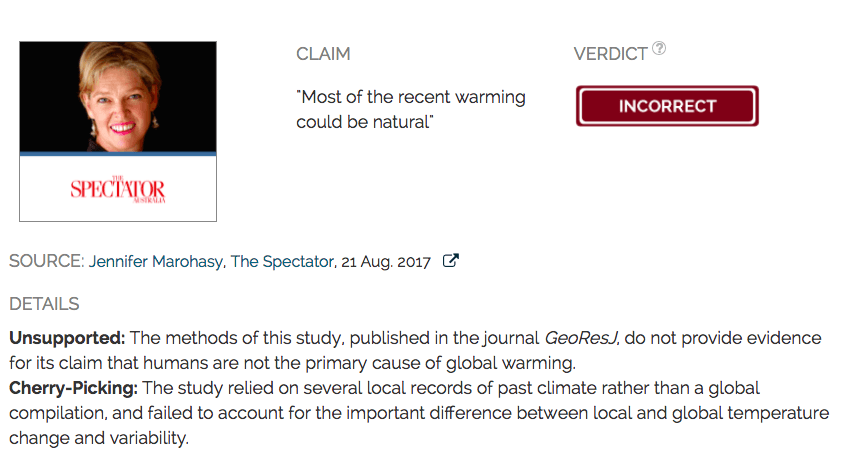
Most of the recent warming could be natural
Verdict detail
Unsupported: The methods of this study, published in the journal GeoResJ, do not provide evidence for its claim that humans are not the primary cause of global warming.
Cherry-Picking: The study relied on several local records of past climate rather than a global compilation, and failed to account for the important difference between local and global temperature change and variability.
Full Claim
Most of the recent warming could be natural [...] we suggest that at most, the contribution of industrialisation to warming over the twentieth century would be in the order of 0.2°C. [...] we also calculate an Equilibrium Climate Sensitivity (ECS) of 0.6°C

Senior Lecturer, University College London
I consider this claim to be incorrect and unsubstantiated.
The authors are right in stating that “The uptake of machine learning, and specifically ANNs, in climate science has generally been slow compared to many other fields.” The assertion that “This may in part be due to the heavy investment in physical models, particularly GCMs.” is not right though—rather it arises from a widespread acknowledgment within the discipline of meteorology that physically-based models have greater predictive power than purely statistical ones (which is why all weather forecasters use general circulation models). The authors here clearly know that humans have increased CO2 levels and that would be expected to alter the energy budget of the climate. There are certain situations where the statistical assumptions going into the sort of Artificial Neural Network built by the authors are just not met. The introduction of a new factor (us and our emissions) not present in the training data (the climate proxy record) is clearly one such situation.
Rather than using their data to claim that recent global warming was natural, it would instead be more appropriate to say that detecting the signal of anthropogenic climate change is hard given the noise of natural variability, especially at local scales. This topic is often referred to as the “emergence” of the climate signal. Ed Hawkins has a nice blogpost on it here. In the maps on that webpage, it shows that climate change (the signal) would not have emerged from natural variations (the noise) until after the end of the proxy records used by Abbot & Marohasy.
I would also have expected the authors to have performed an actual calculation of Equilibrium Climate Sensitivity. They appear to assume (a) the climate system responds instantaneously, (b) CO2 levels have been 100 ppm higher throughout the past 150 years – instead of rising roughly exponentially (c) humans did not impact the climate in other ways—e.g. aerosol emissions, other greenhouse gases, and land use change. All those assumptions are not valid.

Assistant Professor, San Jose State University
1) We know the basic physics of global temperature so it’s incorrect to assume global temperatures follow “natural cycle” sine curves. Temperature is essentially a measure of energy and global temperature changes when an energy imbalance is imposed on the Earth system. This known physics helps us understand global climate changes of the past. The Abbot and Marohasy paper acts as if we don’t know this physics and must rely on curve-fitting (signal analysis) to understand temperature changes. Abbot and Marohasy’s method assumes that temperature changes over centuries move up and down in accordance with sine-curves, with no physical explanation for why temperatures should do that. Earth’s temperature does not know what a sine curve is and there is no reason to think that Earth’s temperature should follow magic “natural cycle” sine-curves.
To be more specific, we know that a large portion of the cooling during the Little Ice Age was caused by negative radiative-forcing from volcanic eruptions:
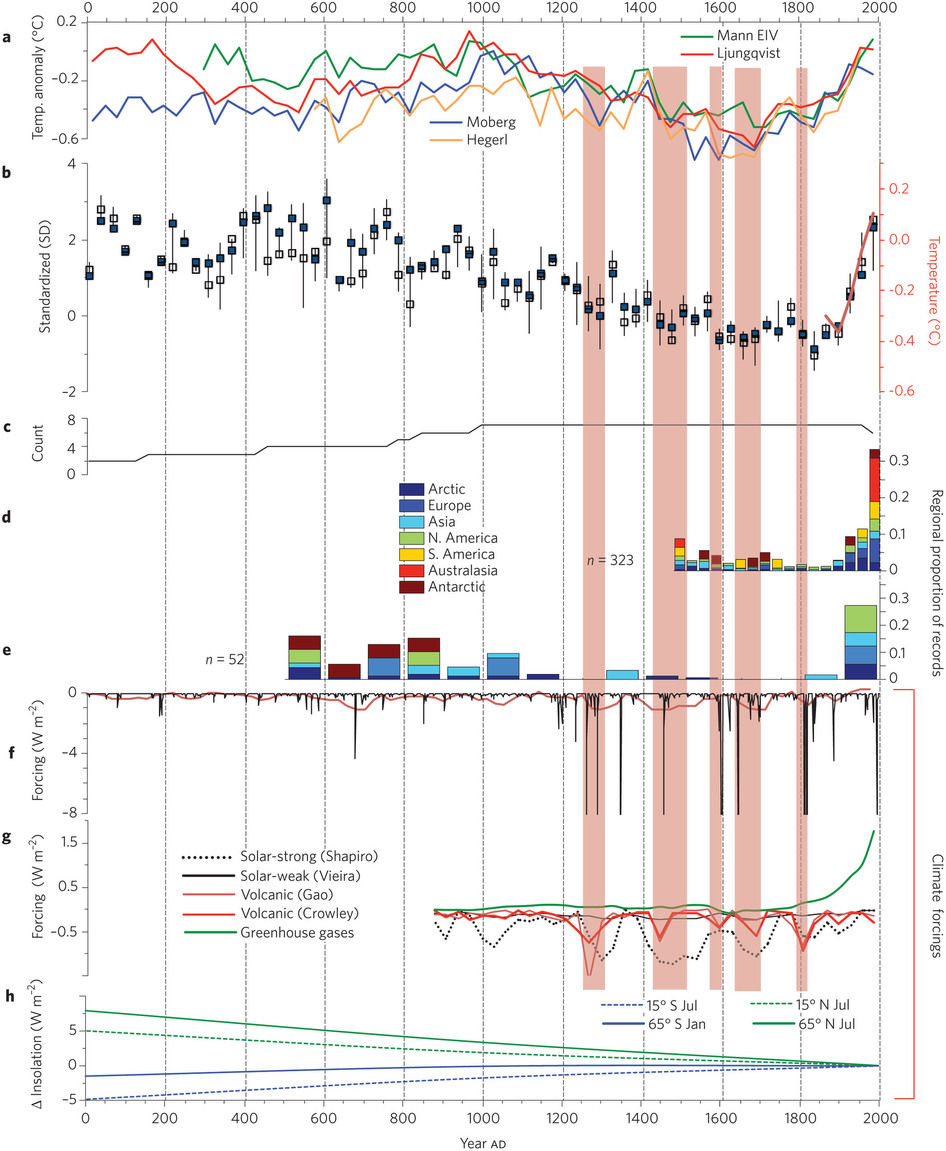
Figure – Composite temperature reconstructions with climate forcings and previous hemisphere-scale reconstructions. Vertical red bands indicate volcanic-solar downturns that explain a large portion of the cooling during the “Little Ice Age”. Source: Pages 2K (2013)
So temperatures went down, not because they were following some magic “natural cycle” sine-curve but because they were pushed downward from Earth experiencing a negative energy imbalance due to volcanic aerosols. Since the current climate change is also being caused by an energy imbalance, scientists can use this information from the past to assess precisely how sensitive temperature is to energy imbalances. So climate changes of the past do not in any way undermine the attribution of current climate change to anthropogenic greenhouse gasses.
The bottom line is that assuming temperature changes blindly follow mathematical functions like sine curves, without considering the known physical reasons for why temperatures change, is scientific nonsense.
2) Their ‘natural cycle’ statistical model cannot predict the recent spike in temperatures. As Gavin Schmidt has pointed out (illustrated here), Abbot and Marohasy mistakenly think that the year 1965 is actually the year 2000. This totally undermines their central claim that their statistical model, based on assumed “natural cycle” sine-curves, can explain recent warming.

Professor, McGill University
It is highly significant for this study that all of the six proxies chosen had proxy temperatures that declined or were at best constant after 1975, underscoring a combination of proxy problems (e.g. dendrochronology) and the unrepresentativeness of the proxy choices. In the “Northern Hemisphere composite” (from [one] Icelandic lake), the temperature even decreases by a whopping 0.3 °C since 1980—yet from the authors’ description, one could be forgiven for thinking that this behaviour was somehow representative of the actual Northern Hemisphere temperature.
Rather than using the original data, the authors scanned the published graphs and used very low resolution versions of the data. From their graphs, it would seem that the resolutions they obtain are between 20 – 50 years (more on this later). This is a shame since in many cases the original data had annual resolution.
These geographic and temporal resolution issues are underlined since they turn out to be fundamental. For example, a dozen or so globally or hemispherically representative pre-industrial multiproxies exist, each based on hundreds or thousands of individual proxies—not just 6. They show that the pre-industrial global temperature series has decadal scale oscillations that are close to ±0.1 °C and this is supported by pre-1900 instrumental data. The true decadal global scale fluctuations are thus about ten times smaller than the local series analyzed by Abbot and Marohasy.
The most important point is that they committed the common but fundamental error of scale, in time, but here, mostly in space. As the authors themselves comment on multiple occasions, on multidecadal time scales the proxy temperatures fluctuate about ±1 °C. This is normal since each proxy only represents the behavior of a tiny region. When the IPCC claims that the industrial epoch temperature has increased by about 1 °C, they are referring to the globally averaged surface air temperature, and this (as we have mentioned) varies only by about ±0.1 °C over decadal time scales. The authors—being apparently unfamiliar with climate science—seem to have missed the factor of 10 discrepancy. And the explanation for the difference is simple. In the pre-industrial epoch, local temperatures varied by ±1 °C over decadal scales, but the variations over different parts of the world tended to cancel out, hence the far lower global variability. However—and this can indeed be seen by careful superposition, even of the authors’ hand picked proxies—in the last century there is a tendency for the local fluctuations to fluctuate together (and upwards!) rather than tending to cancel each other out.
That’s the essence of global warming—it’s not local, it’s global! [Read more]