- Climate
Human-induced increases in greenhouse gases are the primary driver of global warming, contrary to claims in CFACT article
Key takeaway
The effects of CO2 and other greenhouse gas emissions far outweigh the effects of solar forcing on global warming. 100% of the global warming trends observed after 1950 can be attributed to anthropogenic factors.
Reviewed content

Verdict:
Claim:
They tell us that we are the primary forces controlling earth temperatures by the burning of fossil fuels and releasing their carbon dioxide. I hope my readers can recognize the absurdity of their claims. … increasing sunspots are linked to increases in earth temperature
Verdict detail
Incorrect: Anthropogenic increases in greenhouse gas emissions account for 100% of the rapid global warming trends observed after 1950. Solar forcing cannot exclusively explain climate change patterns.
Inadequate support: None of the article’s claims that argue the Sun is responsible for current global warming are supported by published research.
Full Claim
They tell us that we are the primary forces controlling earth temperatures by the burning of fossil fuels and releasing their carbon dioxide. I hope my readers can recognize the absurdity of their claims. … increasing sunspots are linked to increases in earth temperature.
Summary
The claim appeared in an article published by CFACT in April 2020. This claim directly contradicts ample scientific evidence showing that human-caused increases in greenhouse gas emissions, such as CO2, have been the primary driver of global warming[1,2].
Feldman et al (2015) demonstrate that “increasing atmospheric CO2 concentrations between 2000 and 2010 have led to increases in clear-sky surface radiative forcing,” (as seen in the figure below)[1]. When radiative forcing is positive, the Earth absorbs more energy from the Sun than it radiates back to space, causing warming. The authors describe that “Fossil fuel emissions and fires contributed substantially to the observed increase… If CO2 concentrations continue to increase at the current mean annual rate of 2.1 ppm per year, these spectroscopic measurements will continue to provide robust evidence of radiative perturbations to the Earth’s surface energy budget due to anthropogenic climate change.”
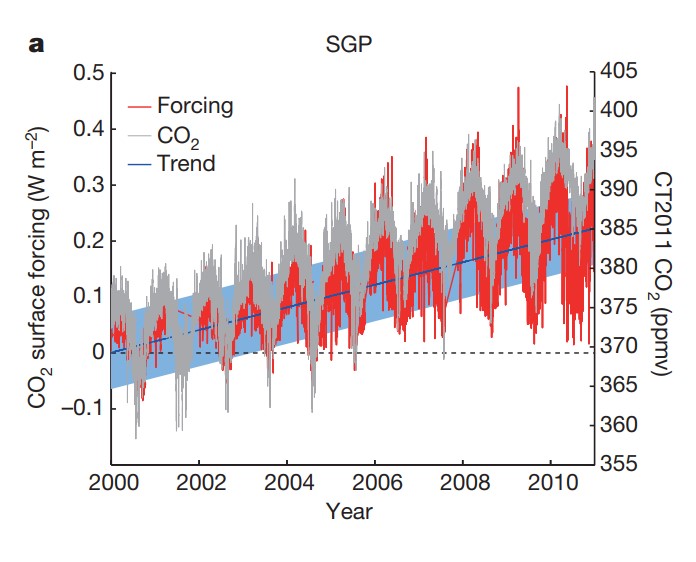
Figure—Increases in CO2 concentrations measured by CarbonTracker 2011 (CT2011) have led to increases in CO2 surface forcing observed at experimental sites in the continental South Great Plains (SGP). From Feldman et al. 2015[1].
Anthropogenic drivers of global warming far outweigh the effects of solar forcing[3,4]. As described in the 2013 IPCC report, “Greenhouse gases contributed a global mean surface warming likely to be in the range of 0.5°C to 1.3°C over the period 1951 to 2010. The contribution from natural forcings is likely to be in the range of −0.1°C to 0.1°C.” These findings contrast with claims made in the CFACT article that the shape of the Earth’s orbit, tilt of the Earth relative to the Sun, and the Sun itself are the main drivers of current climate change. While these mechanisms can cause climate changes over long time periods (e.g. in 20,000 and 100,000 year cycles), these processes occur too slowly to drive patterns of global warming observed in the past 100 years.
Specifically, the article claims that “increasing sunspots are linked to increases in earth temperature,” however, this claim is not supported by scientific evidence. Li et al (2017) analyzed the relationship between the number of sunspots and global warming and found that “solar activity is not a representation of the driving force of the upward trend of global temperature after the industrial age. The Granger causality test results demonstrate that the phenomenon of global warming is caused by excessive CO2 emissions.”[5].
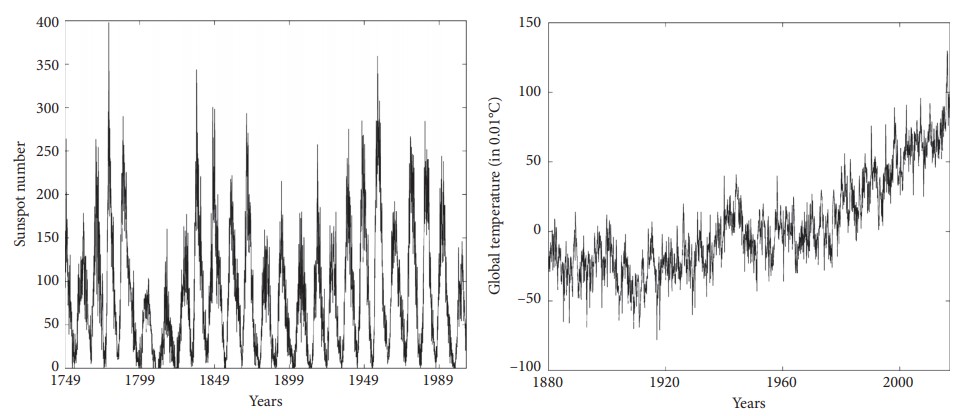
Figure—The monthly average number of sunspots (left) and global surface temperature time series from the Goddard Institute for Space Studies (right). Although sunspot number varies in approximately 11 year cycles, global temperature has steadily increased since 1950.
While natural and anthropogenic factors can affect changes in the climate, multiple lines of scientific evidence demonstrate that recent global warming trends can be attributed to human-caused increases in greenhouse gas emissions and not to the Sun[1,3,4].
Scientists’ Feedback
[Comment from a previous evaluation of a similar claim.]
Global temperature datasets, developed by a number of independent research groups, show robust warming in the troposphere and at the Earth’s surface. The radiative effect of carbon dioxide has also been observed[1]. Considering multiple lines of evidence, the IPCC concluded that it is “extremely likely that human influence has been the dominant cause of the observed warming since the mid-20th century.” More recent analysis of satellite data shows that tropospheric warming from the satellite record is pronounced and cannot be explained by natural climate variability alone[2].
[This comment comes from a previous review of a similar claim.]
Careful analysis that attempts to take into account all major factors and their evolution in time indicates that anthropogenic increases in greenhouse gasses account for more than 100% of the observed warming on the century timescale (requiring cancellation from cooling influences). See the summary graphic from Carbon Brief, below.
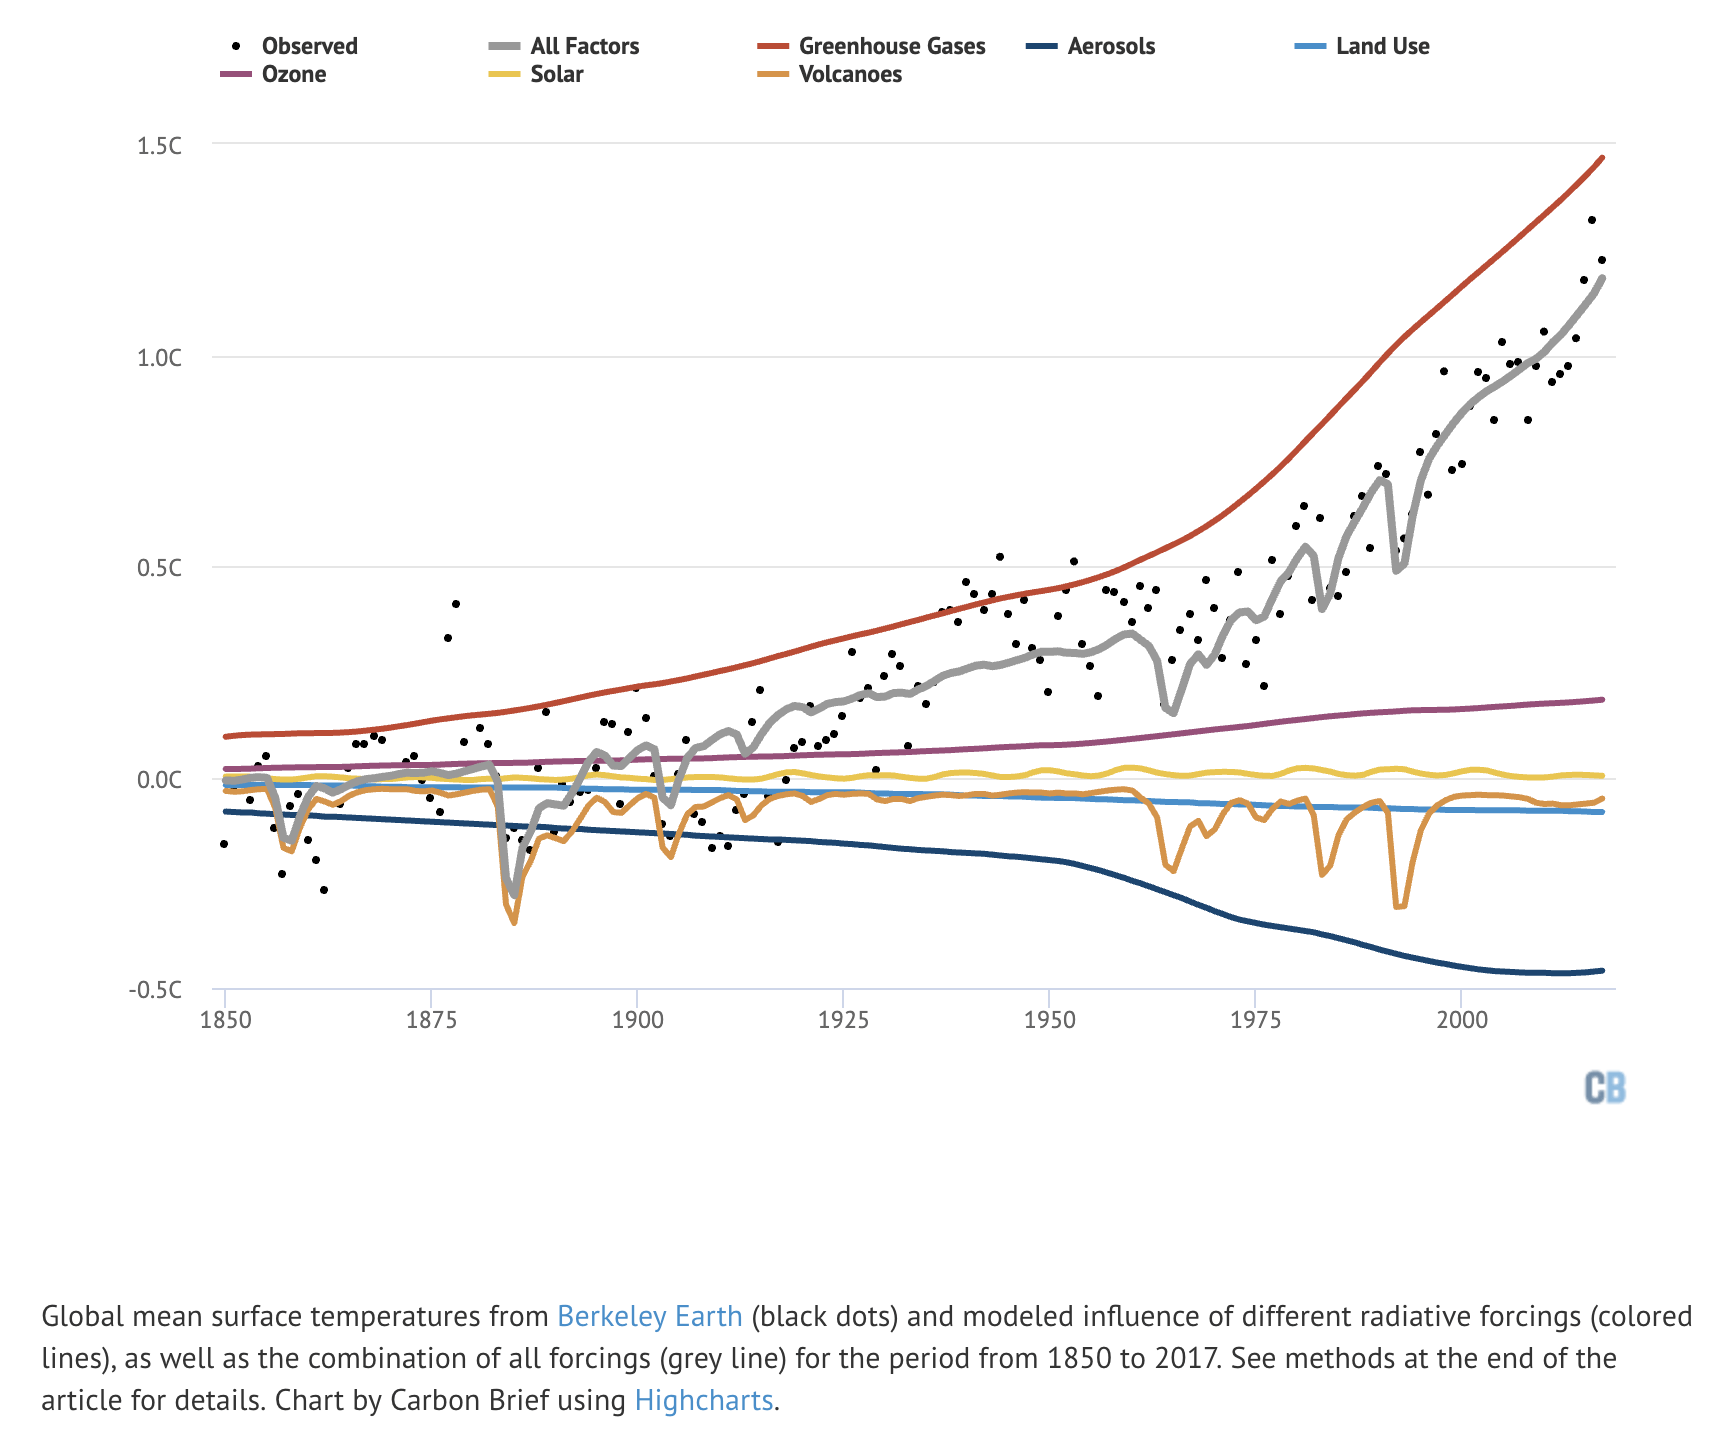
Figure—The estimated role of different factors influencing global surface temperatures from 1850 to 2017. Observed temperatures are shown in black dots. Global warming over the past 150 years was primarily driven by greenhouse gas emissions (red). From Carbon Brief[3].
[This comment comes from a previous review of a similar claim.]
Solar forcing is much smaller than CO2 forcing. As this figure from the 2013 IPCC report shows, CO2 radiative forcing (1.68 W/m2) dwarfs solar forcing (0.05 W/m2)[4]. Along with other greenhouse gases, CO2 dominates the total radiative forcing when all positive and negative factors are taken into account.
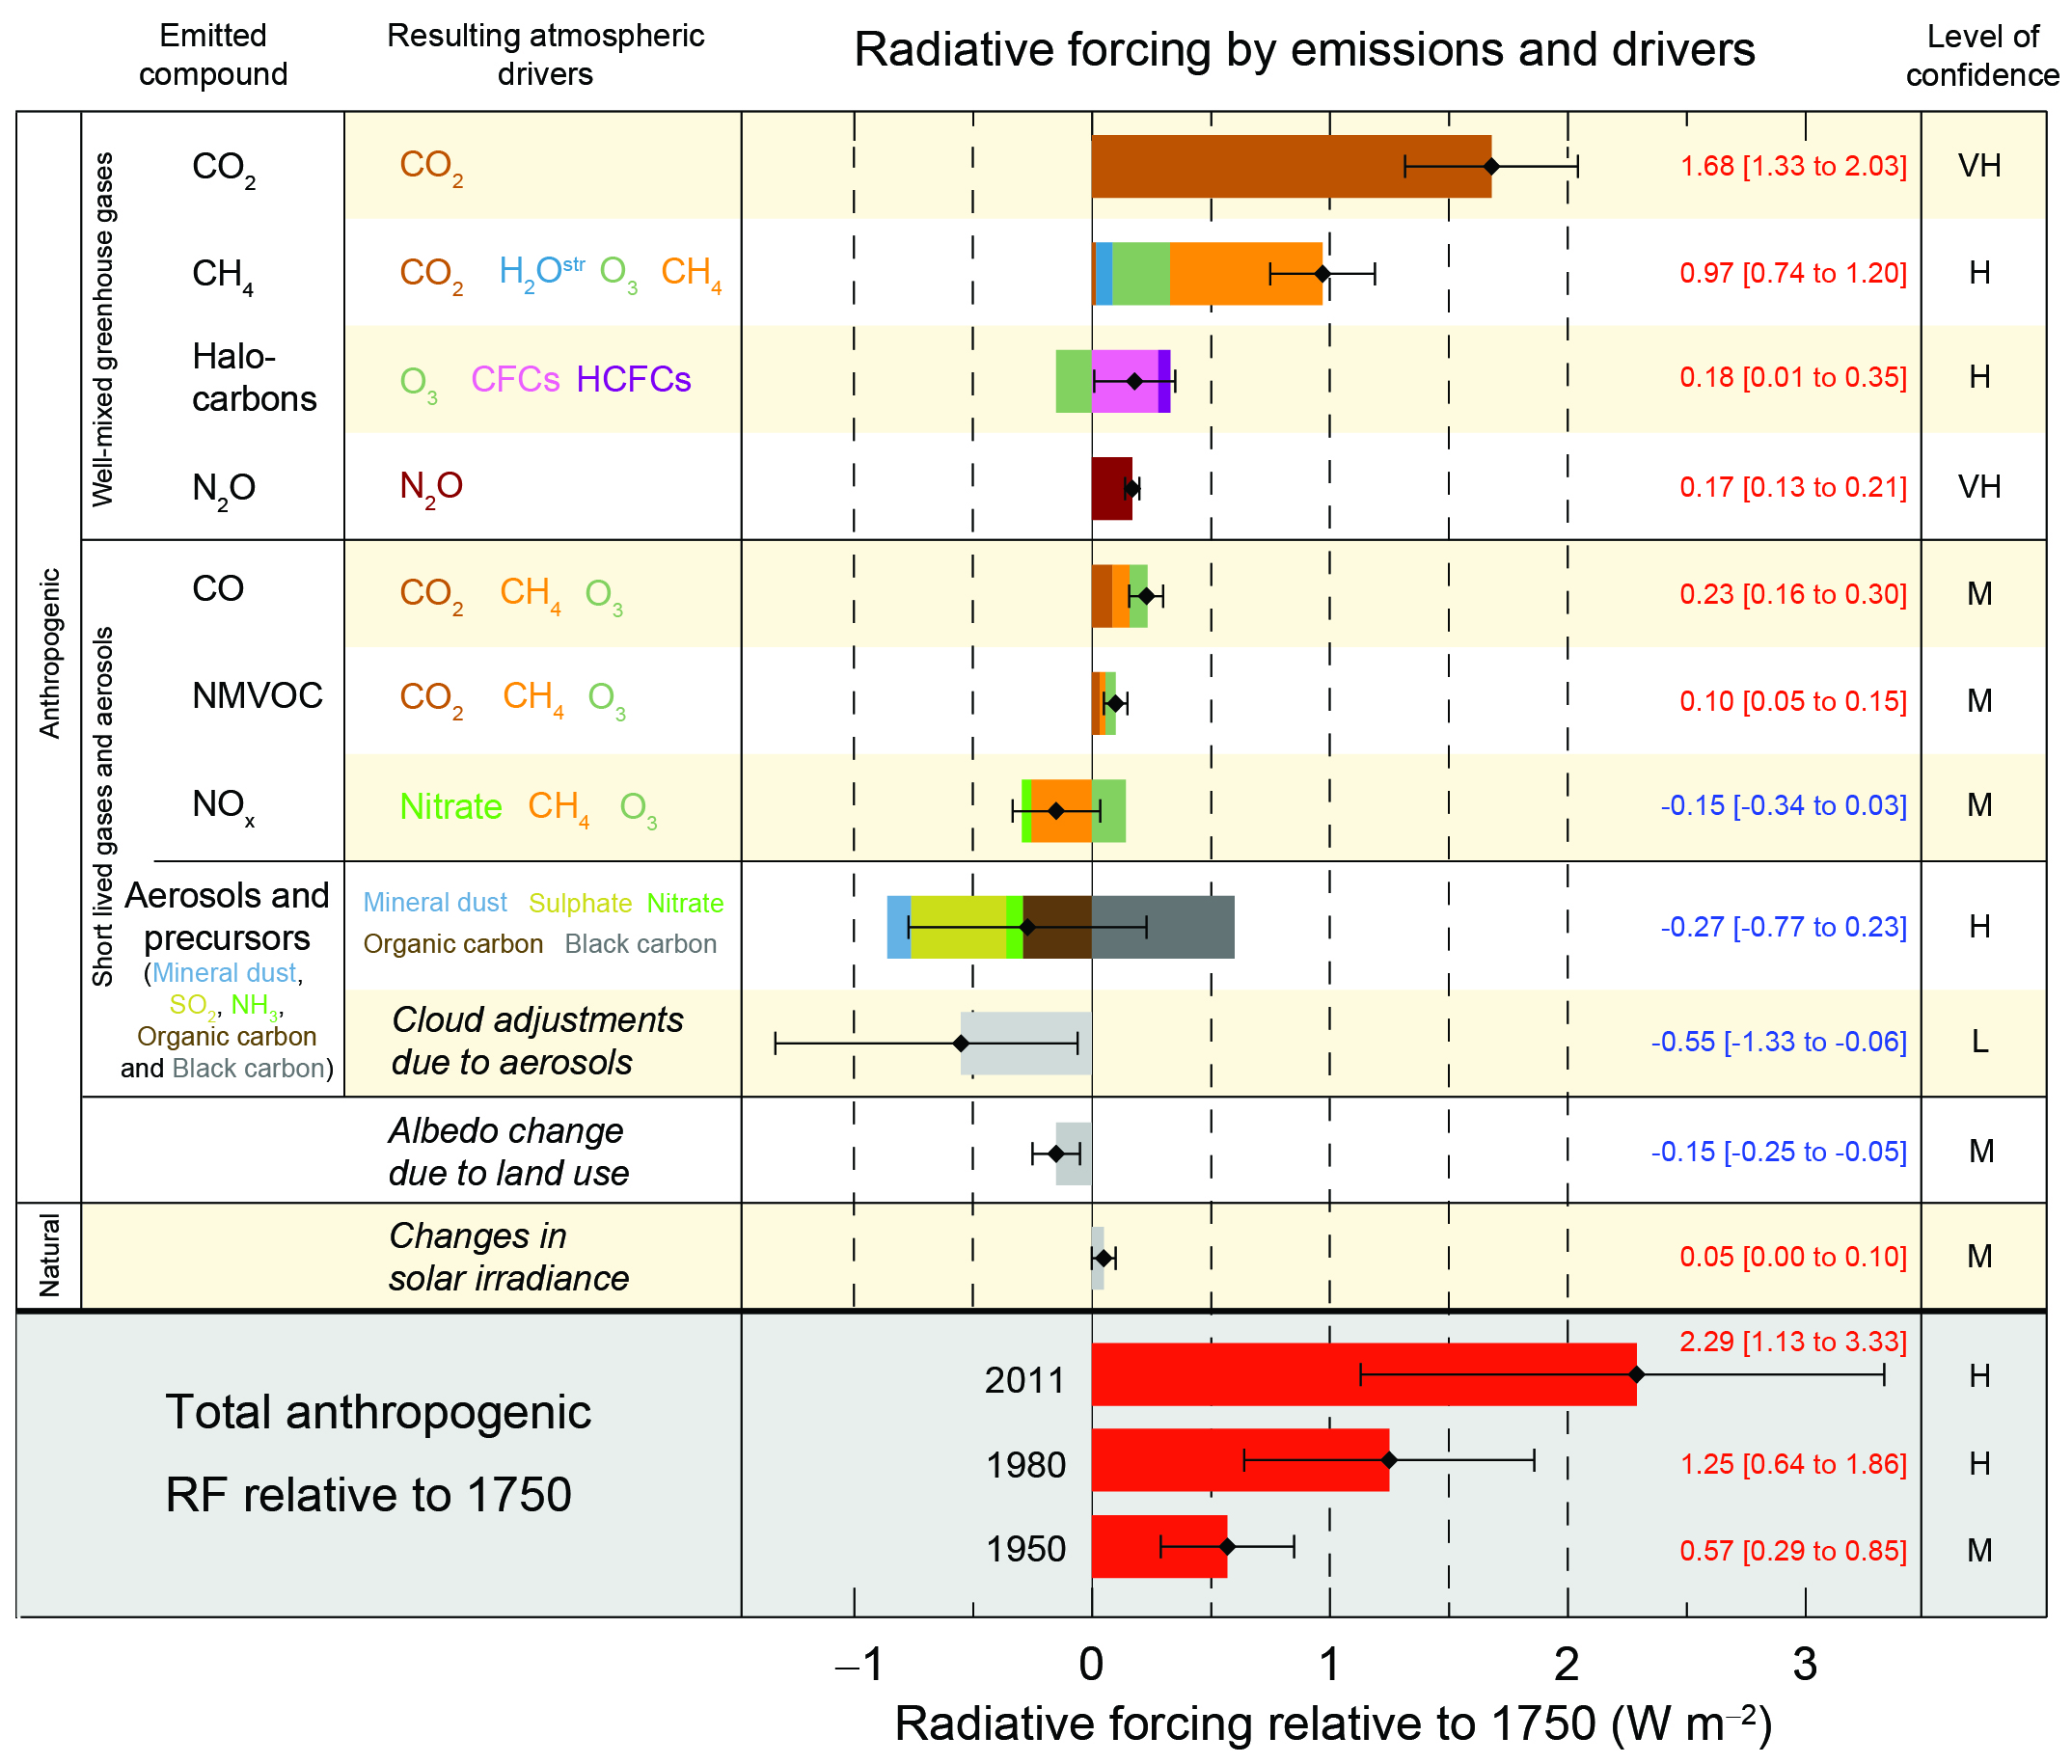
Figure—Radiative forcing estimates in 2011 relative to 1750. Values are global average radiative forcing, partitioned according to the emitted compounds or processes that result in a combination of drivers. Source IPCC AR5[4].
REFERENCES
- 1- Feldman et al (2015) Observational determination of surface radiative forcing by CO2 from 2000 to 2010. Nature.
- 2 – Santer et al (2017) Tropospheric warming over the past two decades. Scientific Reports.
- 3 – Hausfather (2017) The extent of the human contribution to modern global warming is a hotly debated topic in political circles, particularly in the US. Carbon Brief.
- 4 – IPCC, 2013: Summary for Policymakers. In: Climate Change 2013: The Physical Science Basis. Contribution of Working Group I to the Fifth Assessment Report of the Intergovernmental Panel on Climate Change
- 5 – Li et al (2018) Multiresolution analysis of the relationship of solar activity, global temperatures, and global warming. Advances in Meteorology.