- Climate
Global data contradict claim of no acceleration in sea level rise
Key takeaway
Peer-reviewed global analyses of both tide gauge and satellite data have demonstrated that sea level rise has, in fact, accelerated in recent decades.
Reviewed content

Verdict:
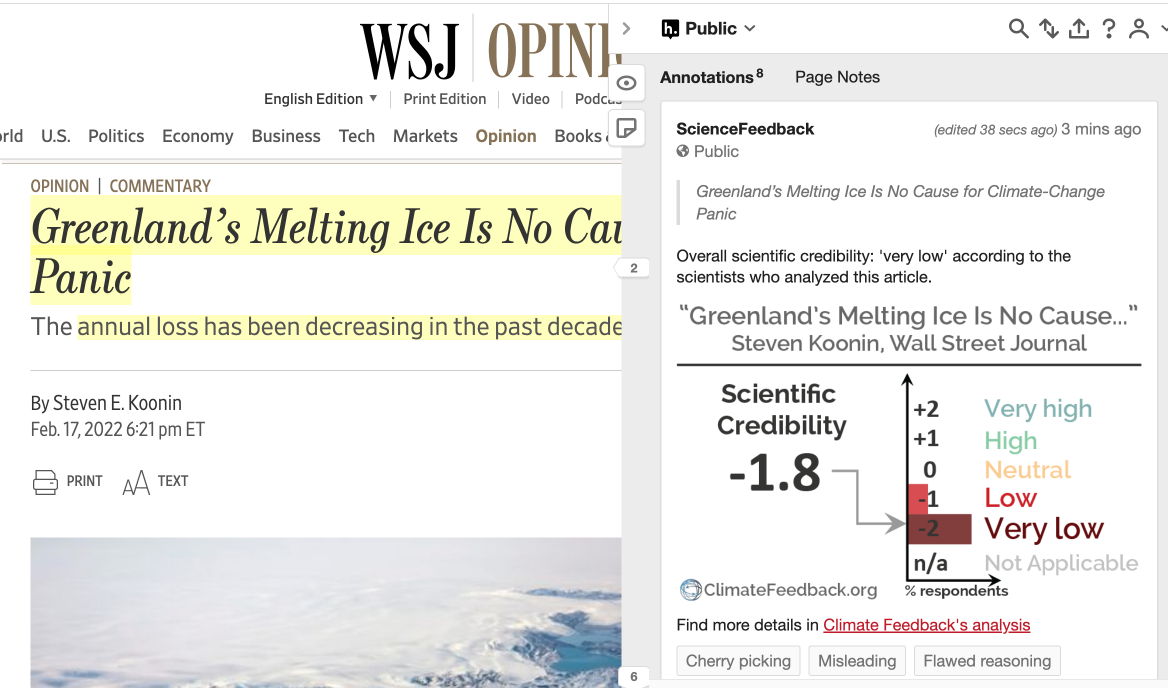
Claim:
The long-term tide gauge datasets are all in agreement that there is no acceleration
Verdict detail
Factually Inaccurate: Quantitative analysis of global data clearly demonstrates that sea level rise has accelerated.
Misrepresents a complex reality: This claim focuses primarily on individual tide gauge stations rather than a global compilation while failing to account for causes of regional variation.
Full Claim
The long-term tide gauge datasets are all in agreement that there is no acceleration, neither in the early nor in the recent parts of the records. Yes, they often porpoise a bit above and a bit below the trend line, but there is no evidence of any CO2-caused recent increase in the rate of sea-level rise. The satellite dataset, on the other hand, is a splice of a selected four of the nine available satellite sea-level datasets. The changes in trend seem to be associated with the splices. Unfortunately, this spliced record is both too short and too fractured to draw any conclusions about acceleration.
This article on the blog “Watts Up With That?” attempts to show that sea level rise is not accelerating by removing “underlying cycles” in the data that are incorrectly assumed to be tidal cycles. The author smooths a selection of individual coastal sea level records and simply looks for visible acceleration. This fails to account for regional variation in sea level or to measure acceleration with an actual calculation. In fact, a proper quantitative analysis of global data—even after this smoothing process—would clearly show acceleration.
The article also claims that satellite sea level data cannot show acceleration because of problems lining up data from different satellites with overlapping mission timeframes. However, the article describes none of the processing procedures that scientists use to correct biases between instruments and instead falsely claims that scientists “simply picked some convenient records from the group above, spliced them together, and called it a valid record fit for all purposes”. In reality, rigorous analysis of satellite data also demonstrates that sea level rise has accelerated.
Scientists’ Feedback

Postdoctoral researcher, Jet Propulsion Laboratory/California Institute of Technology
There’s a lot that goes disastrously wrong in this analysis. The idea is to use a variant of EMD (empirical mode decomposition) to remove cycles in sea-level data to find out whether there’s an acceleration in sea level. While EMD and its variants are powerful tools, there’s one big issue: it does not quantify the presence or non-presence of an acceleration. It is just another approach to low-pass filter a data set.
Low-pass filtering is basically drawing a smooth curve through a noisy data set. An acceleration, on the other hand, is a well-defined phenomenon. We say that there’s an acceleration when we fit a second-order polynomial (a parabola) to the data and the quadratic coefficient is positive. There are rigorous mathematical tools available to determine the presence or absence of accelerations in sea-level records, which are of course not shown here.
The article just shows some smoothed sea-level curves from tide gauges, and it is up to the reader to quantify the presence or non-presence of an acceleration. This of course does not make sense, as we do have good statistical methods to objectively determine this. Then from a purely visual inspection, it’s claimed that because of the multi-decadal cycles in sea-level records—which are falsely attributed to tides (see Woodworth et al.[1] for more details)—we cannot detect an acceleration in the 27-year-long satellite record of sea level. This is a classic and wrong extrapolation.
At first, only a few isolated tide-gauge records are discussed. Mainly because of ocean dynamics, local and regional sea level shows large decadal and multi-decadal variations, and therefore it is indeed difficult to find an acceleration in a single tide gauge record. Only European and US tide-gauge records are shown. Because these tide gauges are relatively close to the places where most of the ice melt that has driven sea-level changes since ~1900, they will see much less sea-level rise from ice melt than the global mean due to gravity and solid-Earth effects. Therefore, without explicitly taking this into account, we cannot say anything about global sea levels based on records in Europe and North America alone. When all available tide-gauge records are combined to compute global sea levels, a clear acceleration in sea level since 1900 is visible[2]. Combined with longer proxy records, the data shows that global sea levels have risen at a faster pace than any other century over the last 3,000 years, and that the 21st-century rate of global sea level is already three times as high as the twentieth-century rate[3].
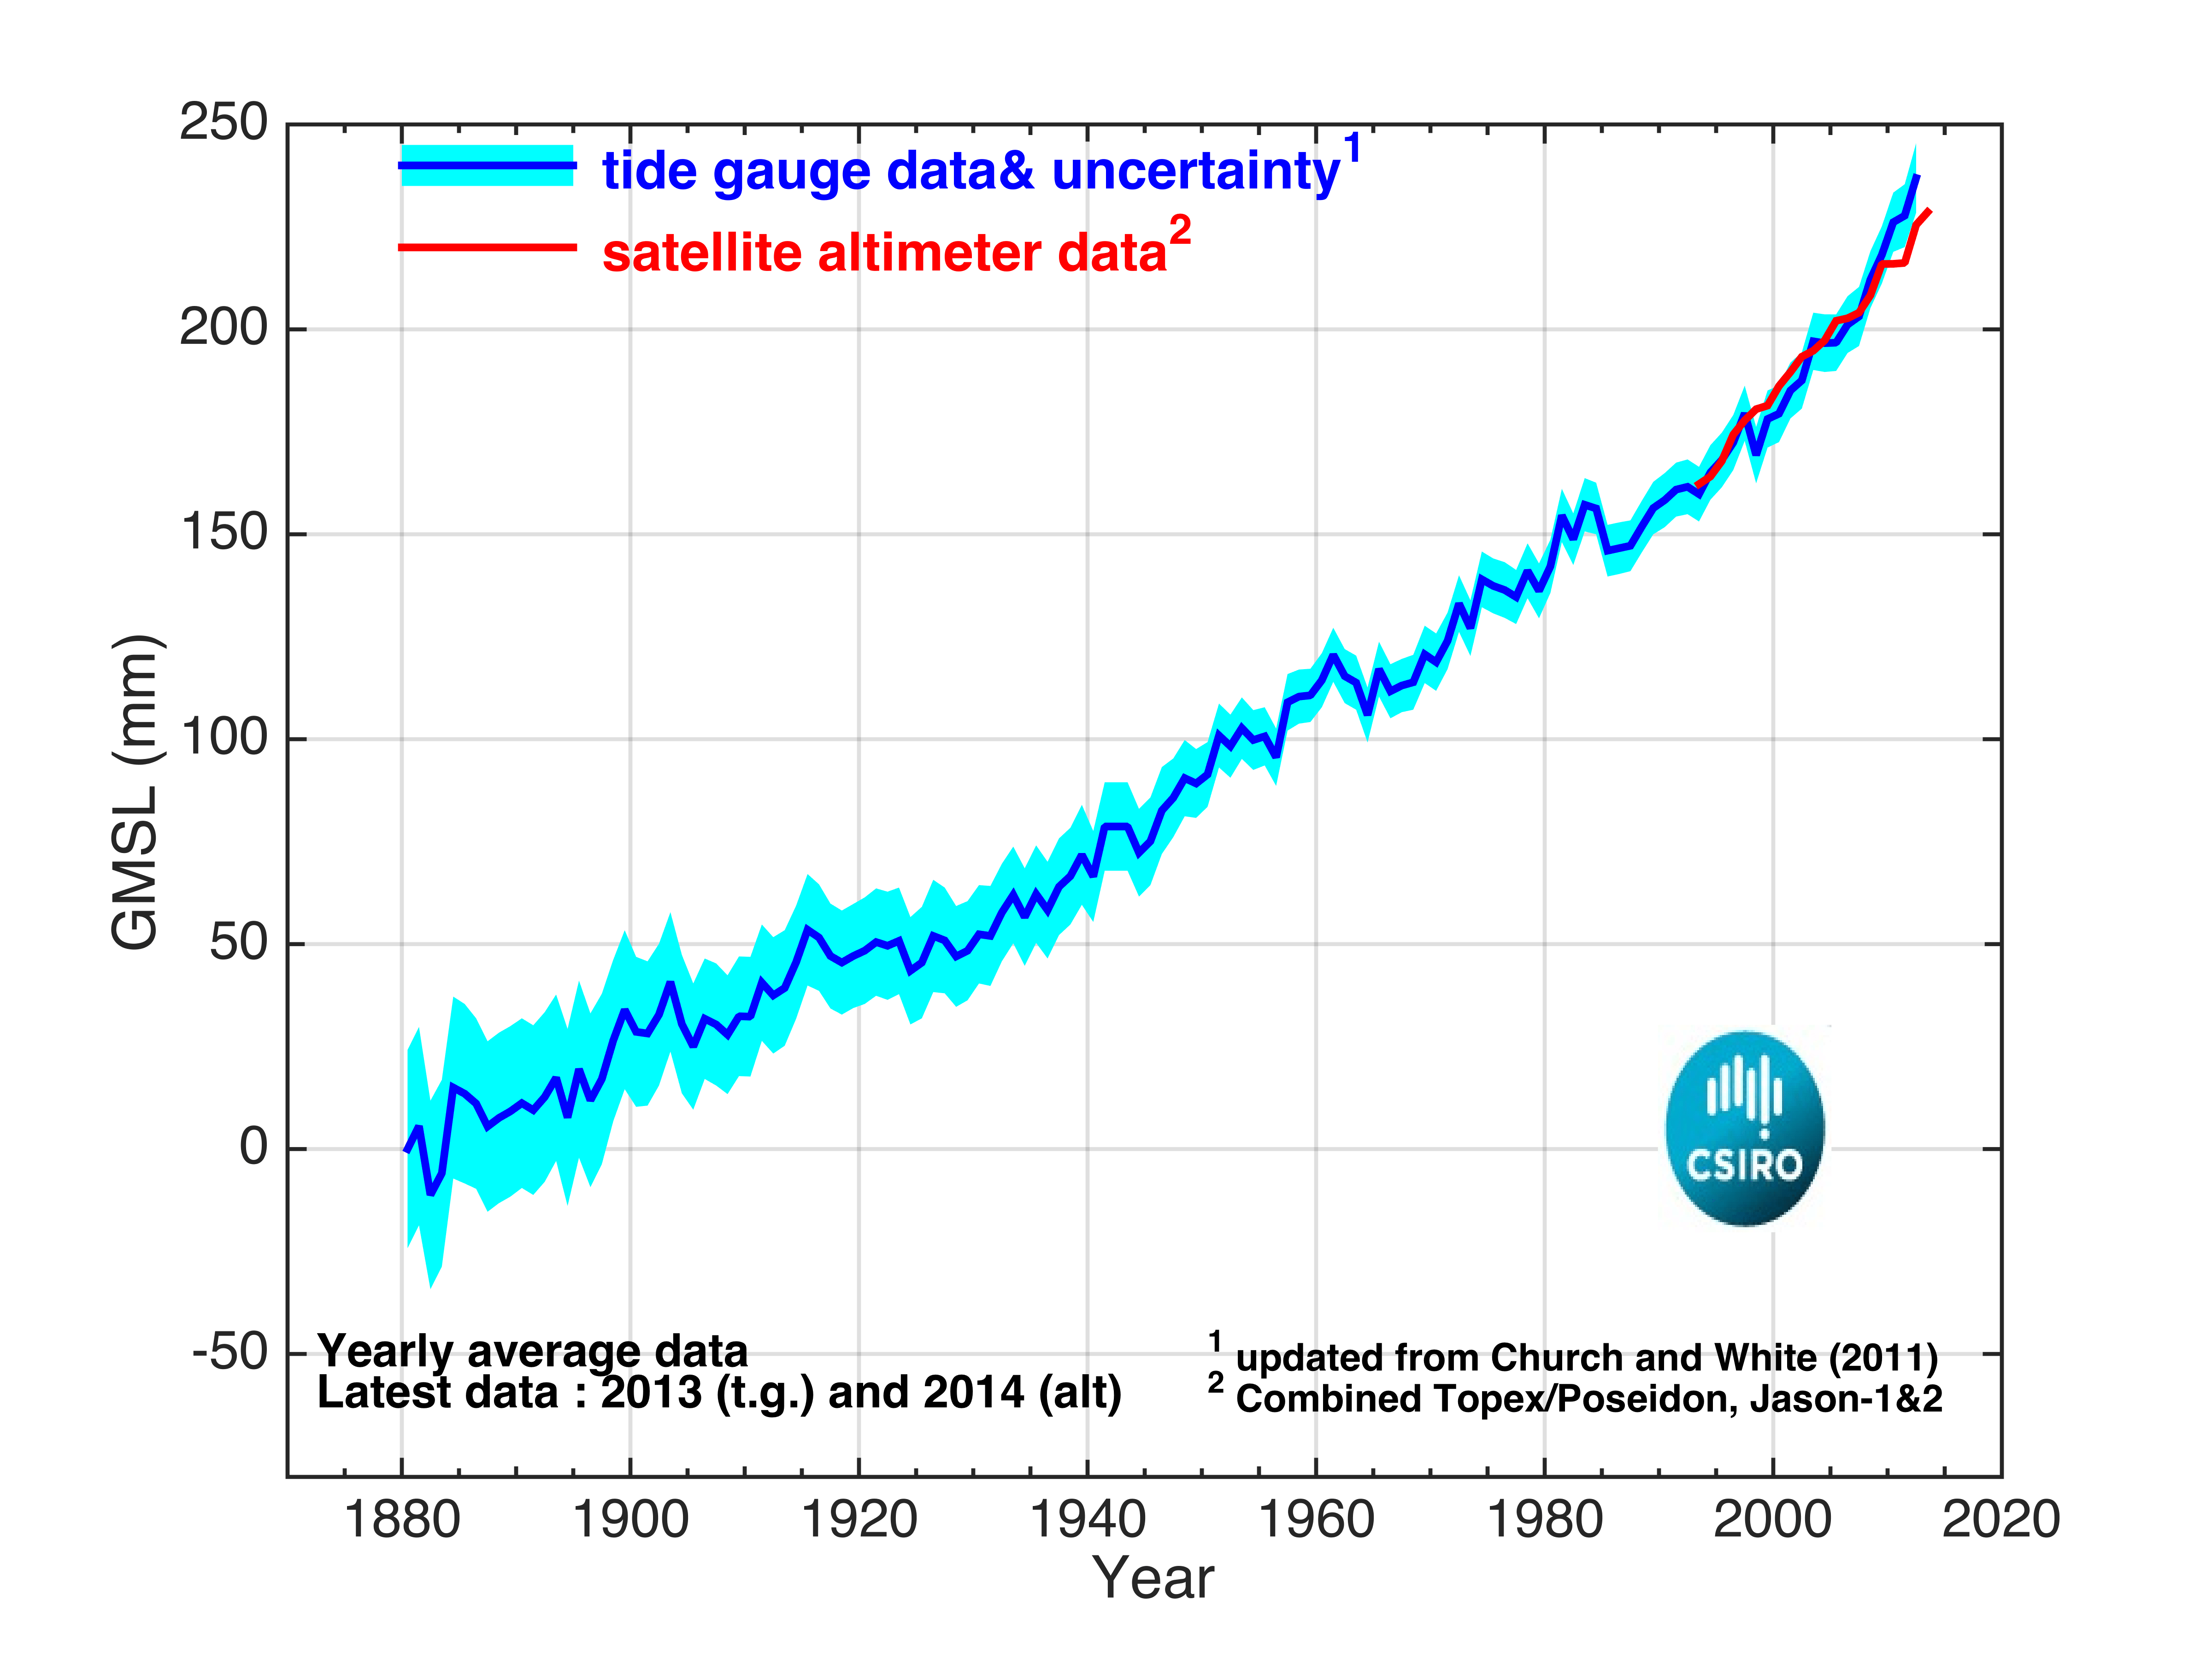
Secondly, the satellite record: Contrary to tide gauges, satellites do cover the global oceans (except some small parts around the poles due to the specific satellite orbits). Regional sea level can show all sorts of decadal fluctuations due to weather and ocean dynamics, which is some sort of redistribution of sea level, but this cancels out on a global scale. Tides, for example, don’t add or remove water from the oceans. Therefore, it’s much easier to detect an acceleration in global sea level. We also track where the extra water is coming from with in-situ floats and satellite gravity observations. These observations tell us remarkably accurately that the acceleration in global sea level is driven by accelerated ice mass losses from Greenland and Antarctica, and due to accelerating thermal expansion because the oceans absorb almost all the excess heat that gets trapped due to the Greenhouse effect (see this paper[4] for all the numbers). Summarizing, we can determine an acceleration in sea level from altimetry and we know what’s causing it.

Professor, Earth Observatory of Singapore
[This comment is taken from a previous evaluation of a similar claim.]
There is so much evidence from satellites, tide gauges, and geological records to show sea-level is rising[5]. For example, from my research, we have shown that the 20th-century rise was extraordinary in the context of the last three millennia—and the rise over the last two decades has been even faster[3].
REFERENCES
- 1- Woodworth et al. (2010) A Note on the Nodal Tide in Sea Level Records, Journal of Coastal Research
- 2- Dangendorf et al. (2019) Persistent acceleration in global sea-level rise since the 1960s, Nature Climate Change
- 3- Kopp et al. (2016) Temperature-driven global sea-level variability in the Common Era, PNAS
- 4- WCRP Global Sea Level Budget Group (2018) Global sea-level budget 1993–present, Earth System Science Data
- 5- Dangendorf et al. (2017) Reassessment of 20th Century Global Mean Sea Level Rise, PNAS.