- Climate
Climate scientists agree that human-caused greenhouse gas emissions are primarily responsible for climate change, contrary to claims in Clear Energy Alliance video
Key takeaway
The vast majority of climate scientists agree that anthropogenic factors are primarily responsible for climate change. Numerous scientific studies and summary reports demonstrate that natural and human influences on the climate can be studied and quantified.
Reviewed content
Verdict:
Claim:
The scientific consensus on whether global warming is human caused is not 97 percent, it’s less than 1 percent. There is no way to measure the human impact on climate change.
Verdict detail
Factually inaccurate: Studies analyzing the peer-reviewed scientific literature show that the vast majority of climate scientists (and research) conclude that anthropogenic factors are primarily responsible for climate change.
Misunderstanding of science: The claim that human impacts on climate change cannot be measured or separated from natural causes contrasts with many lines of evidence demonstrating that human influences far outweigh natural effects.
Full Claim
The scientific consensus on whether global warming is human caused is not 97 percent, it’s less than 1 percent. There is no way to separate natural climate cycles from man made influences such as the burning of fossil fuels. Consequently, there is no way to measure the human impact. If we are having an impact, the question is how much? The honest answer is we just don’t know.
Review
The claims appeared in a Facebook video published by Clear Energy Alliance in June 2020, and has received more than 90,000 views since it was published. The vast majority of climate scientists agree that human-caused greenhouse gas emissions are responsible for most of the change in global climate over the past century[1,2,3]. Climate scientists can also separate natural and man made influences on the climate and quantify anthropogenic impacts, contrary to claims made in the video[2,4,5].
In the video, Mark Mathis states that the scientific consensus that Earth’s recent warming is mostly man made is less than one percent, not 97 percent. This claim contradicts several scientific studies that have found 90 to 100 percent of scientists agree that anthropogenic factors are the main cause of recent climate change[1,3,6,7]. For example, a study by Anderegg and colleagues found that “97 – 98% of the climate researchers most actively publishing in the field surveyed here support the tenets of ACC [Anthropogenic Climate Change] outlined by the Intergovernmental Panel on Climate Change, and (ii) the relative climate expertise and scientific prominence of the researchers unconvinced of ACC are substantially below that of the convinced researchers.”[1] These results are consistent with findings from a study conducted by Cook et al. (2013), which was discussed in the video. The scientific consensus of climate experts on human contributions to climate change is not less than 1 percent as claimed.
According to the IPCC, “It is extremely likely that more than half of the observed increase in global average surface temperature from 1951 to 2010 was caused by the anthropogenic increase in greenhouse gas concentrations and other anthropogenic forcings together.”[2]
The 2017 US National Climate Assessment report states, “This assessment concludes, based on extensive evidence, that it is extremely likely that human activities, especially emissions of greenhouse gases, are the dominant cause of the observed warming since the mid-20th century. For the warming over the last century, there is no convincing alternative explanation supported by the extent of the observational evidence.”[8]
Contrary to several claims made in the video, human influences on climate change can be separated from natural causes and measured, as the reviewers describe below[2,4,5]. For example, the IPCC demonstrates that anthropogenic drivers of global warming far outweigh the effects of solar forcing (see figure below)[9].
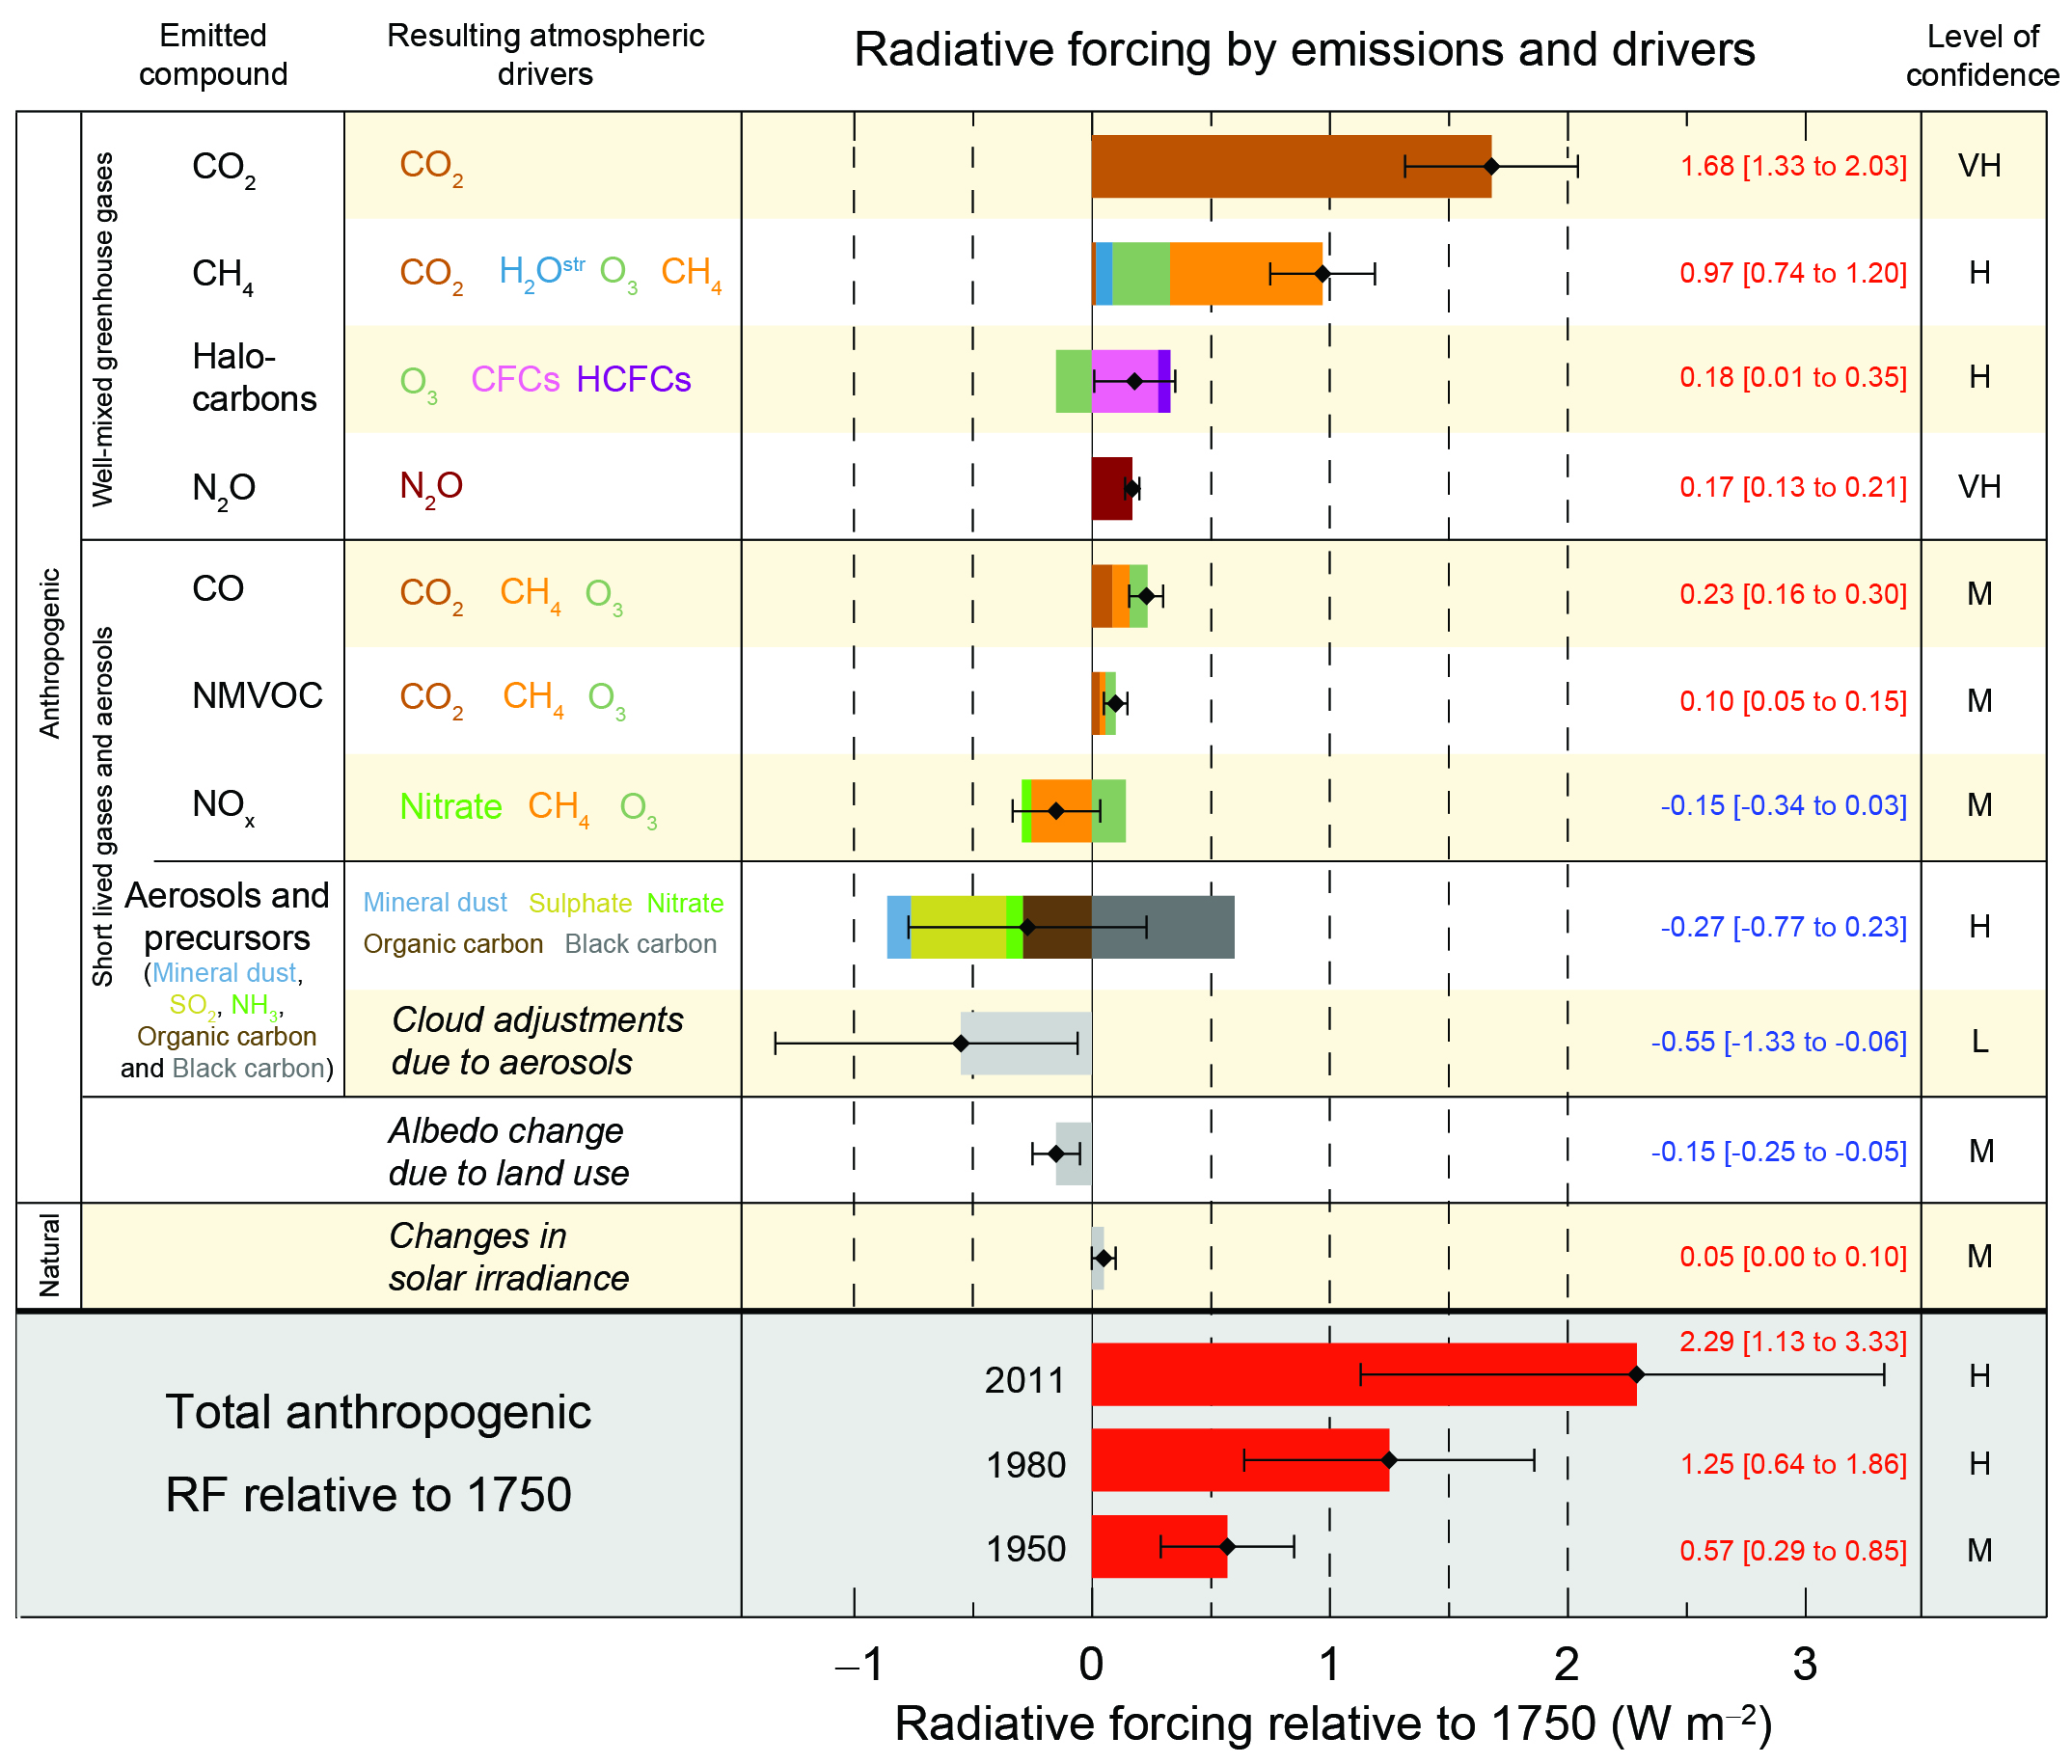
Figure—Radiative forcing estimates in 2011 relative to 1750. Values are global average radiative forcing, partitioned according to the emitted compounds or processes that result in a combination of drivers. Source IPCC AR5[9].
Finally, the video presents a figure comparing climate model predictions to balloon and satellite measurements.
This figure, created by Dr. John Christy, suffers from a number of issues that ultimately mislead readers about differences between the balloon and satellite measurements and climate model predictions. It focuses on temperatures in the mid-troposphere, above the Earth’s surface, and plots the data in a highly misleading way, as described by the reviewers below. The measurements also stop at 2011, omitting the past 9 years of data. In addition, the figure does not show the distribution of error in the balloon and satellite measurements or the spread of model predictions, exaggerating discrepancies between the two.
Scientists’ Feedback

Associate Professor, University of Utah
The video’s claims that the scientific consensus on whether climate change is human-caused is less than 1 percent is utterly false. The video completely misrepresents and misleads about one of the studies on scientific consensus, while completely ignoring that multiple independent studies done by different research teams across the world have separately arrived at consensus levels of 97% or greater. Our study arrived at a 97-98% estimate in 2010[1]. A separate study by Doran & Kendall-Zimmermann found very similar levels of consensus using entirely different methods[3]. Still another study estimated >99% consensus[10]. An entirely different study placed the consensus at over 94%[11]. Thus, there are multiple, independent studies that validate and confirm the Cook et al results[7]. The claims made in this video about the scientific consensus are blatantly false and completely at odds with the peer-reviewed literature.

Professor, Victoria University of Wellington
[Comment from a previous evaluation of a similar claim.]
There are very reliable numerical estimates of the human contribution to warming, as detailed in the last IPCC report. The headline statement from IPCC AR5 was “It is extremely likely that human influence has been the dominant cause of the observed warming since the mid-20th century.”

Director, NASA Goddard Institute for Space Studies
[Comment from a previous evaluation of a similar claim.]
There is indeed overwhelming evidence for warming in the last century. [The] claim that no one knows the attribution of this to human impacts is not a valid description of the state of knowledge. There are indeed plenty of studies that use statistical or model-based fingerprints to assess this and they overwhelmingly find a dominance of human activities over natural forcings or internal variability. For the more recent period (1950 onwards) the claims are even stronger—that effectively all the warming is caused by human activity with only a ~10% uncertainty due to internal variability.

Assistant Professor, San Jose State University
[Comment from a previous evaluation of a similar claim.]
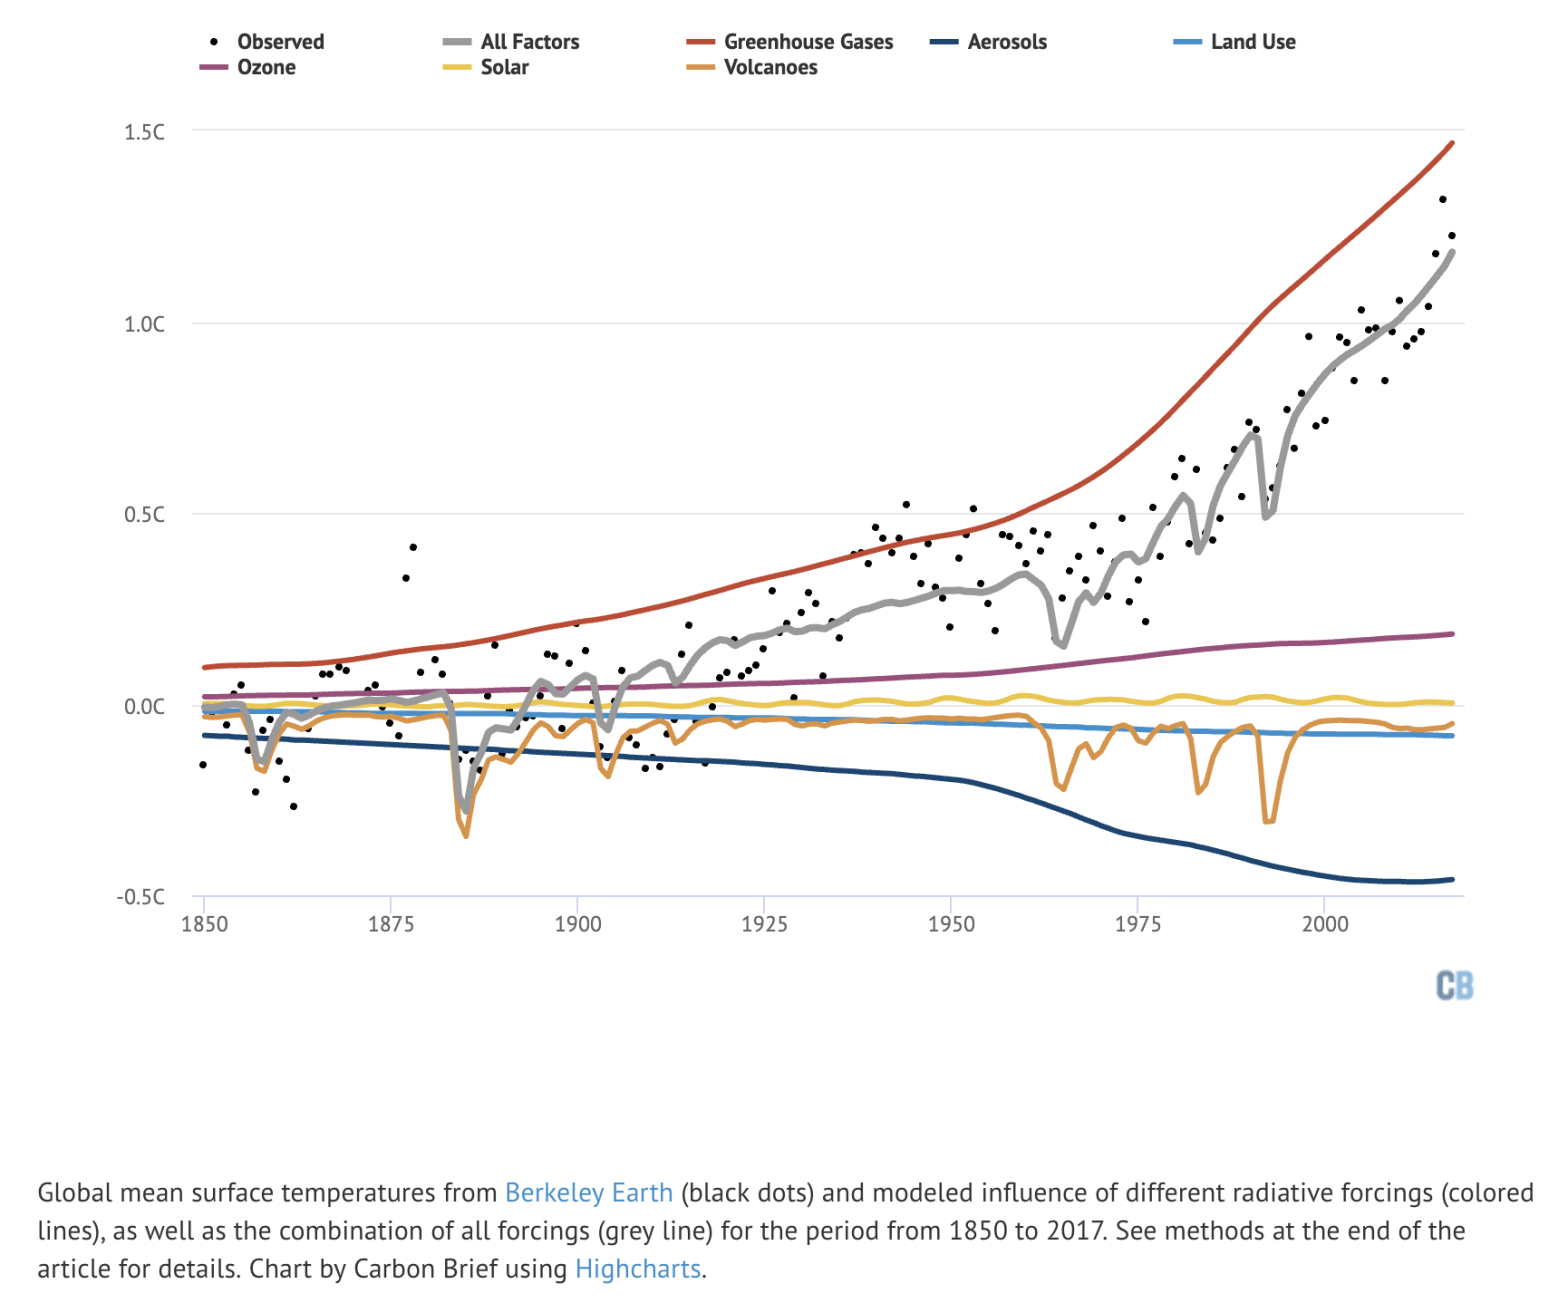
Careful analysis that attempts to take into account all major factors and their evolution in time indicates that anthropogenic increases in greenhouse gasses account for more than 100% of the observed warming on the century timescale (requiring cancellation from cooling influences). See the summary graphic from Carbon Brief, below.

Figure—The estimated role of different factors influencing global surface temperatures from 1850 to 2017. Observed temperatures are shown in black dots. Global warming over the past 150 years was primarily driven by greenhouse gas emissions (red). From Carbon Brief.
Comments on figure comparing models to balloon and satellite data

Scientist, University of Bonn, Germany
[Comment from a previous evaluation of a similar claim.]
John Christy has shown this plot for many years on his blog and in congressional hearings. If it were a robust result, it would be scientifically interesting, however in all these years Christy has not published a scientific article on his claims, and colleagues have had to reverse-engineer how it was made.
One thing that is clear is that due the 5-year averages the strong warming in the last 3 years is strongly suppressed in this plot. Due to the averaging of the balloon datasets and the satellite datasets, the large uncertainty in the observations is no longer visible. It is not good practice to align measurements and models by selecting only one year that happened to have been warm; to reduce the influence of such an arbitrary choice scientists normally use a longer period to align different datasets. Several of these problems have been discussed at RealClimate, but unfortunately Christy has not updated his graph.
Climate models inform us about long-term warming and have not been developed for short-term predictions, which are strongly influenced by fluctuations from, for example, El Niño. The timing of El Nino is not predictable more than a year in advance. This problem is even more the case for the upper air temperatures shown here by John Christy than for the surface temperature. The uncertainty of climate models results for short-term prediction is expected to be about twice the model spread of the CMIP models.
Director, NASA Goddard Institute for Space Studies
[Comment from a previous evaluation of a similar claim.]
As I’ve discussed on RealClimate, Christy makes a number of minor and one major choice in his graph that all combine to exaggerate the discrepancy between models and observations of the mid-troposphere changes. The major issue is that he does not show the structural errors in the observations, nor does he compare to the spread in the model output. Better graphs that do not make those partial choices are available:
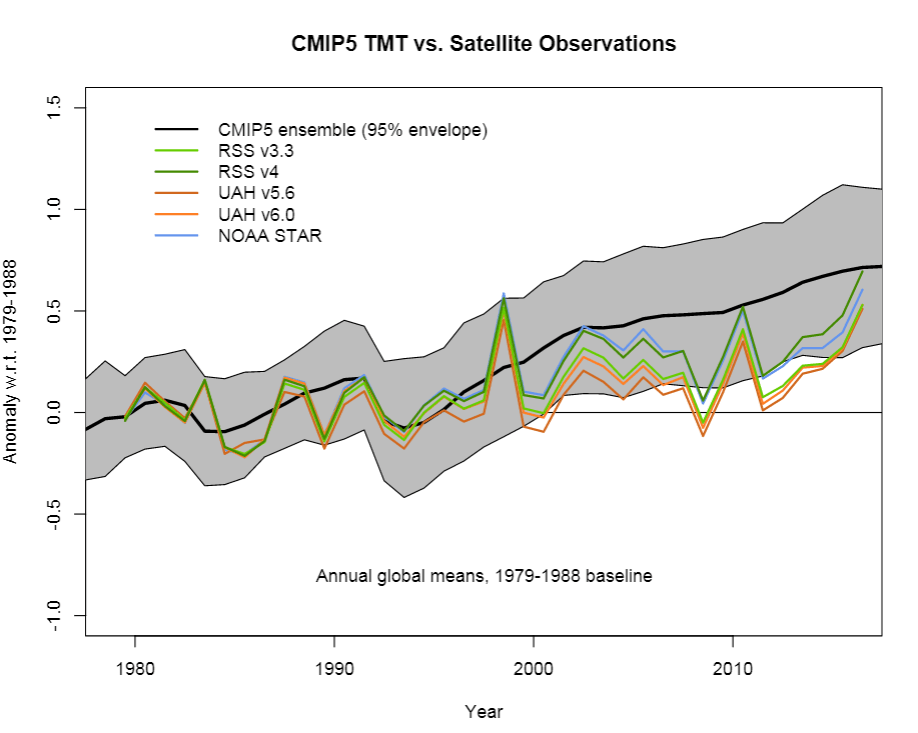
This is not to say that there are no discrepancies—there are, just not as dramatic as Christy claims. The bulk of the trends in the models for this metric are above what is reported, but with any discrepancy, there are multiple potential causes which all need to be looked at[12]. 1) the observations may be wrong, 2) the models may be wrong, 3) the experiments may not have been realistic, or 4) the comparison is flawed. While #4 has historically been the case for many satellite-model comparisons in the past, it is no longer much of a problem. However, #1 remains a distinct possibility—and ongoing revisions to these datasets often give rise to systematic shifts in the trends. #2 is also possible—though assuming the only issue must relate to climate sensitivity is naive. But #3 is a known problem—the CMIP5 simulations did not have sufficient volcanoes, and did not predict the decrease in solar activity over the last decade or so[12]. Ignoring #1 and #3 in favor only of a claim about #2 is not good science. Note too that on other metrics the models are ok, or don’t shift as quickly as observed (sea ice, Hadley cell expansion, etc.)—only discussing issues where the bias is one specific way, is again a very partial approach.
REFERENCES
- 1 – Anderegg et al. (2010) Expert credibility in climate change. PNAS.
- 2 – IPCC (2014) Climate Change 2014: Summary for Policymakers. Contribution of Working Groups I, II and III to the Fifth Assessment Report of the Intergovernmental Panel on Climate Change.
- 3 – Doran et al. (2009) Examining the scientific consensus on climate change. Eos.
- 4 – Santer et al. (2013) Human and natural influences on the changing thermal structure of the atmosphere. PNAS.
- 5 – Feldman et a. (2015) Observational determination of surface radiative forcing by CO2 from 2000 to 2010. Nature.
- 6 – Cook et al. (2013) Quantifying the consensus on anthropogenic global warming in the scientific literature. Environmental Research Letters.
- 7 – Cook et al. (2016) Consensus on consensus: a synthesis of consensus estimates on human-caused global warming. Environmental Research Letters.
- 8 – Wuebbles et al. (2017) Executive summary. In: Climate Science Special Report: Fourth National Climate Assessment, Volume I
- 9 – IPCC, 2013: Summary for Policymakers. In: Climate Change 2013: The Physical Science Basis. Contribution of Working Group I to the Fifth Assessment Report of the Intergovernmental Panel on Climate Change
- 10 – Powell (2015) Climate scientists virtually unanimous: anthropogenic global warming is true. Bulletin of Science, Technology and Society.
- 11 – Rosenberg et al. (2010) Climate change: a profile of US climate scientists’ perspectives. Climatic Change.
- 12 – Schmidt et al. (2014) Reconciling warming trends. Nature Geoscience.
UPDATES
- 26 June 2020: This post was updated to include a comment from William Anderegg.